Michael’s Story

Michael's story

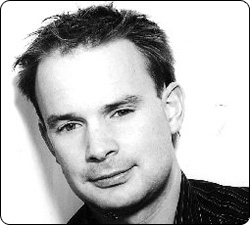
Michael Broom was born September 1975 near Maidenhead. For the first 6 years of his life he was a healthy lad, but then he began to feel unwell, with symptoms of dizziness, sickness (both during the day and at night) and headaches.

For the next 3 years, up to April 1985 Michael became increasingly ill and doctors were unable to locate why. The headaches were increasingly severe. He was being sick every night. Hand to eye co-ordination and balance was becoming poor and simple daily tasks became difficult. Michael was unable to dress himself for school and perform simple daily tasks.

Now aged 9, Michael deteriorated whilst on a family holiday in Paris. Shortly after he collapsed at school and was taken to the Neurosurgery Department at the Radcliffe Infirmary in Oxford for the latest medical assessment. There he had a brain scan for the first time and the team of surgeons diagnosed hydrocephalus and a grade 4 astrocytoma in the 4th ventricle. The team inserted a VP shunt to alleviate the pressure on the brain tumour and then a week later had it removed. A course of radiation then followed.

Over the course of the next 3 years a further three operations followed to replace bits of the shunt that became blocked. All was well until October 1999 when he suffered a cerebral bleed that cause severe discomfort for one month. This was followed by a low-pressure brain haemorrhage in March 2006 that again caused discomfort for at least 4 months.

School Days

I was only a little boy when I was first ill. I just didn’t think much of it; I carried on running for my School, Crosfields, in Reading and played on the 1st rugby team until I was admitted to the Radcliffe Infirmary in 1985. I also played mini-rugby for Henley. I knew I was ill but I had no idea how severe it was. The doctors didn’t know, so how was I or my parents supposed to know? When I was told that I had to spend some time in hospital I saw it as the chance to spend time off school: great news for a 9-year-old boy! But when it dawned on me that I would have to repeat a year I wasn’t too happy!

Looking back on it now I guess my parents shielded me from how close I had come as I think they thought I couldn’t deal with it at that age. They were probably right. From 1986 to 1994 I continued through school, passing my common entrance to get into St Edwards in Oxford – a choice that was made to be near the hospital which was doing my surgery. There I did my GCSE and A levels, entering Leeds University in 1994 to read Geography and Management BSc. It was while I was at school that I slowly learnt about my medical past.

The hardest thing about being at school was being seen as different; I was not allowed to play rugby or go running. I guess the doctors, teachers and parents were protecting me to some extent. But this was difficult as I really wanted to play rugby. I rowed for the school but always for the 2nd grade team. I took up golf shortly after my brain tumour was removed, to play a non contact sport. In my final year I was made Captain of Golf at my School. I did do a skydive shortly after my 16th birthday, the lowest age you can do one without your parents consent.

University was good for me; I led a normal, university life with all the trials and tribulations that being a student brings.

Travelling

Michael Skiing

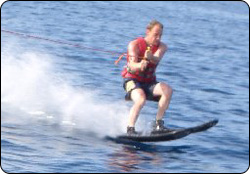
Upon graduating I was unsure what I wanted to do so I packed my bags and went off round the world. This has been the best thing I ever did. It’s not the experiences that I had, it was the fact that free from teachers, doctors, parents etc that I was able to find out what sort of person I was and nobody had preconceived opinions of me because I didn’t let them know my medical history. It was great. Contrary to everybody’s advice, my GP, my surgeon, my insurance company etc I did nineteen bungee jumps in Australia and New Zealand, with no ill effects. This was an amazing time for me; being told that I can’t do this and I can’t do that for most of my life was hard to deal with, I wanted to do something for me. I guess it was sort of ‘a fingers up’ to my brain tumour; you got removed twelve years ago and you are not going to affect my life anymore. I had no adverse effects from the bungee jumps except from the hangover that followed when I partied all night in Cairns, Queensland. I then told the staff why I did eight of those nineteen in one day – they weren’t best pleased! Even funnier was when I got home some 18 months later that I sat my parents in front of the video and played all nineteen. Their faces – a picture! I sailed for three months round the South Pacific, worked on a sheep farm for another three months, went skydiving, more bungee jumps, all amazing experiences!

Working Life

I came back late October 1998 and started training in London as an Independent Financial Adviser. I had the cerebral bleed in October 1999. I was devastated. I thought all that brain stuff was gone. I was on holiday at the time and had to fly home to Oxford. Luckily, the same team was there and identified and treated the problem quickly and efficiently. It is so reassuring to know that wherever I am in the world if anything goes wrong in my brain the world class team at Oxford can sort it out. To have the same faces there lessened the impact of having to re-enter hospital. It was while I was in hospital that I realised I needed to do something for me again. Travelling was not on the cards; I needed to get on with my career. I decided to rekindle my interest in running from my pre brain tumour days and I entered the London Marathon. Never having run more that three miles in my life, I began training after New Year 2000 and managed to do the course in four hours three minutes. Those three minutes have bugged me ever since and I have vowed to do it again, but I can’t get in!

Doing the marathon was another moment in my life where I did what I wanted to do. I did it against medical advice, but it was the best thing for me. I continued to work in London and then moved to Henley on Thames to work for an Independent Financial Advice company owned by a firm of Chartered Accountants. I had these severe headaches, a low pressure brain haemorrhage, in March 2006 and again it was back up to Oxford, same names and faces and everything was sorted. I go ski-ing at least once a year and now refuse to wear a crash helmet. I know I probably should but years of being at ski school as the only one with a helmet was not fun – now I’ve rebelled against that and I want to ski-free. It would be like sailing wrapped up in cotton wool: it’s not me.

brainstrust

Michael Sailing

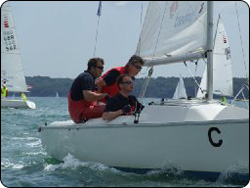
I have thrown myself into sailing and have been racing in Cowes all summer, when not at work! It was there that I met Will, Meg’s brother, who asked me to meet her and my contribution to this website is the result.

Basically what I am trying to say is that while I have been severely ill I have not let it dominate my life. On the contrary, you have to live life to the fullest; my friends are always amazed at what I get up to next! My motto at the moment is “plant your experiences now to harvest your memories later.” Think about and follow that and you can’t go wrong.

If you would like to contact me to discuss my experiences and how they match with yours or you have a child who has a similar ailments please contact brainstrust, and for a small donation to the Trust I will be only too happy to help.

With brainstrust, you are never alone. Click here to get in touch with one of our trained volunteers who has been through the same experiences you are going through.

Introduction

The Brain Tumour Data Dashboard lets you explore up -to-date, population level data about the brain tumours diagnosed in England between 2013 and 2015. Using the drop down menus on the left you can select different groups of patients to view in the charts below. In these charts the number of patients for every 100 diagnoses is displayed as images of people. Patients have been grouped by date of diagnosis, type of tumour, age, gender, and region in England.

For each group of patients you can explore the different routes to diagnosis, the proportion of those who received chemotherapy or radiotherapy, as well as the survival of the patients within each group. For more information about what these metrics mean please see the glossary.

How to use

  1. Select the year of diagnosis using the drop down menu.
  2. Select your patient group of interest from the four drop down menus in the following order:
    1. Tumour group
    2. Age at diagnosis
    3. Region of England
    4. Gender of patient
  3. To view a second chart to compare different groups of patients, click the ‘compare’ button.The second chart will appear below the first chart.

*Note that the tool is best used on a laptop or tablet rather than a mobile phone*

Unavailable data

Some of the data in these charts is not available.There are two main reasons for this:

  1. How the data has been grouped

If you cannot select a patient group from the drop down menus, the data is unavailable because of how the data has been organised.

Public Health England has grouped the data like a branching tree. The bottom of the tree contains all the patients with brain tumours, and then each branch divides the data by a certain characteristics, like age, or location of tumour. But the data is divided in an order, starting with location of the tumour (endocrine or brain), then by age, region, and gender. Age is at the start because it makes a bigger difference to survival rates and treatment rates than gender or region. Sometimes, after the data has been split by type of tumour and age, there is not enough data to be split again. This is because to protect patient confidentiality groups cannot contain less than 100 patients. Because some groups cannot be split further, you cannot create ‘totals’ for everyone by region or gender. For example, you cannot see results for all ages by region, or all brain tumours by gender. If these totals were calculated and released, it might be possible to identify patients, which is why Public Health England cannot release this data.

  1. Statistical reasons and data availability

If you can select a patient group from the chart menus, but the chart does not display, the data is unavailable for one of several reasons:

  1. Data is not yet available for the selected year from Public Health England.
  2. Data is not available because the data quality is too poor to release this statistic.
  3. Data is not available as the statistic is not appropriate for this group.
  4. Data is not available because the standard error of the estimate was greater than 20% and so the estimate has been supressed.

Up to date brain tumour data

Brain tumour data may influence the decisions you make about your care. Data also helps you understand the bigger picture, or landscape, in which you find yourself.

Brain tumour data and statistics influence the focus, and work of organisations like brainstrust. The information helps us to understand the scale and impact of the problems we are setting out to solve.

This tool helps you understand the landscape in which you find yourself having been diagnosed with a brain tumour. This landscape can be particularly tricky to navigate as there are many different types of brain tumour, all of which have a different impact.

The information you see represents the most up-to-date, official, population level brain tumour data available for England. Over time we will be adding to the brain tumour data available and publishing reports, with recommendations, as a result of what we learn from this data.

The data behind this content has come from Public Health England’s National Cancer Registration and Analysis Service (NCRAS) and is a direct result of the ‘Get Data Out’ project.

This project provides anonymised population level brain tumour data for public use in the form of standard output tables, accessible here: http://cancerdata.nhs.uk/standardoutput

Incidence

The number or rate (per head of population) of new cases of a disease diagnosed in a given population during a specified time period (usually a calendar year). The crude rate is the total number of cases divided by the mid-year population, usually expressed per 100,000 population.

Malignant

Malignant tumours which grow by invasion into surrounding tissues and have the ability to metastasise to distant sites

Mortality

The number or rate (per head of population) of deaths in a given population during a specified time period (usually a calendar year). The crude rate is the total number of deaths divided by the mid-year population, usually expressed per 100,000 population.

Non-malignant

Not cancerousNon-malignant tumours may grow larger but do not spread to other parts of the body.

Survival

The length of time from the date of diagnosis for a disease, such as cancer, that patients diagnosed with the disease are still alive. In a clinical trial, measuring the survival is one way to see how well a new treatment works. Also called ‘overall survival’ or ‘OS’.

Routes to Diagnosis

Under the ‘Routes to Diagnosis’ tab in the Brain Tumour Data Dashboard, you can explore the ways patients have been diagnosed with brain tumours. There are many ways, or routes, for cancers to be diagnosed in the NHS. A ‘route to diagnosis’ is the series of events between a patient and the healthcare system that leads to a diagnosis of cancer. The routes include:

  1. Two Week Wait

Patients are urgently referred by their GP for suspected cancer via the Two Week Wait system and are seen by a specialist within 2 weeks where they are diagnosed.

  1. GP referral

Diagnosis via a GP referral includes routine and urgent referrals where the patient was not referred under the Two Week Wait system.

  1. Emergency Presentation

Cancers can be diagnosed via emergency situations such as via A&E, emergency GP referral, emergency transfer or emergency admission.

  1. Outpatient

Outpatient cancer diagnoses include diagnoses via an elective route which started with an outpatient appointment that is either a self-referral or consultant to consultant referral. (It does not include those under the Two Week Wait referral system).

  1. Inpatient elective

Diagnosis via an inpatient elective route is where diagnosis occurs after the patient has been admitted into secondary care from a waiting list, or where the admission is booked or planned.

  1. Death Certificate Only

Diagnoses made by Death Certificate Only are made where there is no more information about the cancer diagnosis other than the cancer related death notifications. The date of diagnosis is the same as that of the date of death.

  1. Unknown

For some patients with a cancer diagnosis, there is no relevant data available to understand the route to diagnosis.


More information

If any of the statistical terms in this section of the brainstrust website are hard to understand, we recommend looking them up here:

Cancer Research UK’s Cancer Statistics Explained

http://www.cancerresearchuk.org/health-professional/cancer-statistics/cancer-stats-explained/statistics-terminology-explained#heading-Seven

If you are looking for help understanding terms relating specifically to brain tumours, and treatment, then the brainstrust glossary is available here:

https://www.brainstrust.org.uk/advice-glossary.php