Andy’s story:

For Andy Tudor, 2017 began in a whirlwind. Coming home from work feeling poorly on 11 Jan, it was only 7 weeks later that he had returned home from hospital following neurosurgery to remove a large meningioma.

Determined to raise awareness around the symptoms, experience of and recovery from a brain tumour – and to tell the story with his own humorous twist – Andy has written up his experiences.

He describes 2017, the year of his diagnosis and treatment for a large meningioma, as “a year of firsts”. His first stay in hospital, operation, and the first time he really thought about his own mortality.

“It’s also been the first time I’ve been able to stop and fully appreciate the true depth of love, support, warmth from many family and friends. It has been a truly humbling experience”.

Warning signs

Andy had a few symptoms from around 6 months before his diagnosis. These included flashing lights in his peripheral vision, occasionally taking the wrong turns when walking or driving, and a limp. Easy to overlook with his busy lifestyle, Andy assumed these to be to do with getting older, and trips to the GP for isolated incidents didn’t reveal any underlying issues.

However, 24 hours before being taken to hospital, Andy’s symptoms suddenly became far more intense and severe. Loss of control of his left arm and leg, intense headaches and repeated vomiting left Andy in desperate need of the hospital – and so he went by ambulance…

It’s ‘a big one’

After a few days in hospital, it was clear that Andy had a large meningioma – in the doctor’s words, “a big one”. The symptoms he had experienced were a result of the swelling caused around the edge of the mass as it pushed on his brain. The danger lay in his brain being herniated (pushed down the spine) as it had nowhere to go from the swelling. There were signs that this was beginning to happen, so an action plan was put together. Fortunately, the steroids were reducing the swelling, so during this time of stability a plan could be formulated.

6 weeks on steroids

Andy wasn’t sleeping, apart from the occasional 15 minute snooze, thanks to his steroids. Nights were spent watching TV, doing puzzles and feeding his insatiable hunger!

I’m spending my time in a cocoon of tv news/sport & weather, papers, magazines, Sudoku’s, grazing, and napping. All helping to keep me nice and calm.  And my first benefit of all this – we’ve now also got BT Sport! NBA basketball tonight and Liverpool v Swans on the weekend plus baseball, etc. Good job I’m on steroids to keep me awake for all this sport!”

When he finally received the date of his surgery, Andy felt a mixture of emotions – the gut reaction being relief. Having never been in hospital, let alone being put under general anaesthetic, Andy thought that he would be terrified before the operation. The fact that it was a routine procedure, with high survival rates, helped him to stay calm. He found that not asking what would happen in detail (and staying away from Google about this!) had helped him to worry less.
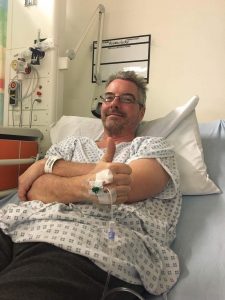
The op

Within 2 hours of his surgery, Andy was texting people to say he was OK! Always keeping his sense of humour, Andy’s first message that he sent to his kids was in Chinese, as they’d had a running joke that he might wake up from the op able to speak mandarin!

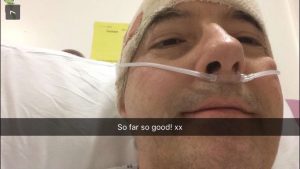
I then sent many family and friends the same message: “The surgery was successful! They removed it all in a 6 hour operation. Removing my mahussive grin may take a little longer!”

Andy’s surgery had gone well, but there had been some bleeding during the operation. He had also acquired shingles, but despite this he was able to return home 2 days after his surgery.

What Andy’s diary captures next is how the aftermath of surgery, when you leave hospital and return to life as you knew it, is often the most uncertain and difficult time.

Recovery from surgery, shingles, bruising and a fluid filled scar on his head – these things took longer. Andy happily welcomed sleep back into his life as he was weaned off his steroids, but the next few months were a period of ups and downs.

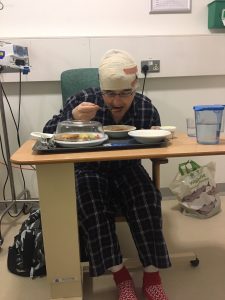
6 weeks post-surgery, despite being told by loved ones he “looks fantastic” and despite being back waking and talking like normal, Andy was feeling low and easily drained, which was confusing for him and difficult to understand. He had expected to be jumping for joy after his successful surgery!

“It does take time to heal from the shock as well. Let alone from the operation itself. Family and friends just see us smiling and up and about like we used to be – they don’t see the internal struggle. Takes time to heal mentally as well physically.”

Fatigue was something that really affected him following his surgery. Learning to manage your fatigue takes time – we have a resource that will help (download it here).

After four months, Andy was able to begin gradually returning to his job in software management. He was part-time at first, increasing his hours from two 4-hour days a week back to full time 9 months post op.

There are all sorts of reasons why returning to work after a brain tumour can be difficult. Check out our Returning to Work Know How for advice on how to do this at a pace that’s right for you.

And now?

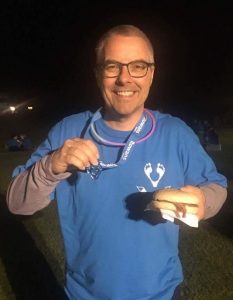
Andy has now been back working full time 18 months, and has been enjoying his ‘normal life’, with his second annual scan recently coming back all clear.

“I realise there are many who don’t have such a positive outcome as I have, but I thought I’d share my story to hopefully show that positive outcomes are possible and common”

Andy has written up his story here in more detail (aptly named Tumour Humour) for those who would like to read it.

Introduction

The Brain Tumour Data Dashboard lets you explore up -to-date, population level data about the brain tumours diagnosed in England between 2013 and 2015. Using the drop down menus on the left you can select different groups of patients to view in the charts below. In these charts the number of patients for every 100 diagnoses is displayed as images of people. Patients have been grouped by date of diagnosis, type of tumour, age, gender, and region in England.

For each group of patients you can explore the different routes to diagnosis, the proportion of those who received chemotherapy or radiotherapy, as well as the survival of the patients within each group. For more information about what these metrics mean please see the glossary.

How to use

  1. Select the year of diagnosis using the drop down menu.
  2. Select your patient group of interest from the four drop down menus in the following order:
    1. Tumour group
    2. Age at diagnosis
    3. Region of England
    4. Gender of patient
  3. To view a second chart to compare different groups of patients, click the ‘compare’ button.The second chart will appear below the first chart.

*Note that the tool is best used on a laptop or tablet rather than a mobile phone*

Unavailable data

Some of the data in these charts is not available.There are two main reasons for this:

  1. How the data has been grouped

If you cannot select a patient group from the drop down menus, the data is unavailable because of how the data has been organised.

Public Health England has grouped the data like a branching tree. The bottom of the tree contains all the patients with brain tumours, and then each branch divides the data by a certain characteristics, like age, or location of tumour. But the data is divided in an order, starting with location of the tumour (endocrine or brain), then by age, region, and gender. Age is at the start because it makes a bigger difference to survival rates and treatment rates than gender or region. Sometimes, after the data has been split by type of tumour and age, there is not enough data to be split again. This is because to protect patient confidentiality groups cannot contain less than 100 patients. Because some groups cannot be split further, you cannot create ‘totals’ for everyone by region or gender. For example, you cannot see results for all ages by region, or all brain tumours by gender. If these totals were calculated and released, it might be possible to identify patients, which is why Public Health England cannot release this data.

  1. Statistical reasons and data availability

If you can select a patient group from the chart menus, but the chart does not display, the data is unavailable for one of several reasons:

  1. Data is not yet available for the selected year from Public Health England.
  2. Data is not available because the data quality is too poor to release this statistic.
  3. Data is not available as the statistic is not appropriate for this group.
  4. Data is not available because the standard error of the estimate was greater than 20% and so the estimate has been supressed.

Up to date brain tumour data

Brain tumour data may influence the decisions you make about your care. Data also helps you understand the bigger picture, or landscape, in which you find yourself.

Brain tumour data and statistics influence the focus, and work of organisations like brainstrust. The information helps us to understand the scale and impact of the problems we are setting out to solve.

This tool helps you understand the landscape in which you find yourself having been diagnosed with a brain tumour. This landscape can be particularly tricky to navigate as there are many different types of brain tumour, all of which have a different impact.

The information you see represents the most up-to-date, official, population level brain tumour data available for England. Over time we will be adding to the brain tumour data available and publishing reports, with recommendations, as a result of what we learn from this data.

The data behind this content has come from Public Health England’s National Cancer Registration and Analysis Service (NCRAS) and is a direct result of the ‘Get Data Out’ project.

This project provides anonymised population level brain tumour data for public use in the form of standard output tables, accessible here: http://cancerdata.nhs.uk/standardoutput

Incidence

The number or rate (per head of population) of new cases of a disease diagnosed in a given population during a specified time period (usually a calendar year). The crude rate is the total number of cases divided by the mid-year population, usually expressed per 100,000 population.

Malignant

Malignant tumours which grow by invasion into surrounding tissues and have the ability to metastasise to distant sites

Mortality

The number or rate (per head of population) of deaths in a given population during a specified time period (usually a calendar year). The crude rate is the total number of deaths divided by the mid-year population, usually expressed per 100,000 population.

Non-malignant

Not cancerousNon-malignant tumours may grow larger but do not spread to other parts of the body.

Survival

The length of time from the date of diagnosis for a disease, such as cancer, that patients diagnosed with the disease are still alive. In a clinical trial, measuring the survival is one way to see how well a new treatment works. Also called ‘overall survival’ or ‘OS’.

Routes to Diagnosis

Under the ‘Routes to Diagnosis’ tab in the Brain Tumour Data Dashboard, you can explore the ways patients have been diagnosed with brain tumours. There are many ways, or routes, for cancers to be diagnosed in the NHS. A ‘route to diagnosis’ is the series of events between a patient and the healthcare system that leads to a diagnosis of cancer. The routes include:

  1. Two Week Wait

Patients are urgently referred by their GP for suspected cancer via the Two Week Wait system and are seen by a specialist within 2 weeks where they are diagnosed.

  1. GP referral

Diagnosis via a GP referral includes routine and urgent referrals where the patient was not referred under the Two Week Wait system.

  1. Emergency Presentation

Cancers can be diagnosed via emergency situations such as via A&E, emergency GP referral, emergency transfer or emergency admission.

  1. Outpatient

Outpatient cancer diagnoses include diagnoses via an elective route which started with an outpatient appointment that is either a self-referral or consultant to consultant referral. (It does not include those under the Two Week Wait referral system).

  1. Inpatient elective

Diagnosis via an inpatient elective route is where diagnosis occurs after the patient has been admitted into secondary care from a waiting list, or where the admission is booked or planned.

  1. Death Certificate Only

Diagnoses made by Death Certificate Only are made where there is no more information about the cancer diagnosis other than the cancer related death notifications. The date of diagnosis is the same as that of the date of death.

  1. Unknown

For some patients with a cancer diagnosis, there is no relevant data available to understand the route to diagnosis.


More information

If any of the statistical terms in this section of the brainstrust website are hard to understand, we recommend looking them up here:

Cancer Research UK’s Cancer Statistics Explained

http://www.cancerresearchuk.org/health-professional/cancer-statistics/cancer-stats-explained/statistics-terminology-explained#heading-Seven

If you are looking for help understanding terms relating specifically to brain tumours, and treatment, then the brainstrust glossary is available here:

https://www.brainstrust.org.uk/advice-glossary.php