Christopher Millward, a junior clinician who works closely with brain tumour patients in Liverpool, decided he wanted to do something huge for brain tumour support, having witnessed firsthand the difference it makes to the lives of his patients and their carers. He chose to compete in the Ironman Wales Triathlon, one of the toughest challenges in the world.
“When people say to me that the Ironman is impossible, that it is crazy, and ask why I would want to put myself through it, I think of things that really are tough. Having a brain tumour is tough, losing your personality or your ability to live your life like you used to is tough, trusting people to take care of you in surgery and bring you out the other side intact is tough, and losing a loved one to a brain tumour is tough. The pain of completing this race could never match that. In fact, it makes you grateful and humble. I thought about all those people that have been affected by brain tumours during the race, not only my patients, but friends and family too. It gave me the strength to push on and reach the finish line” – Christopher Millward
He went on to raise an incredible £700 for our support service. Thanks so much Christopher, for all you do for those living with a brain tumour.
You can read the full, gruelling yet amazing tale of the Christopher’s triathlon and his reasons for taking part below.

You have probably never heard of the Ironman so I will briefly explain; it’s a triathlon, consisting of a swim, followed by a bike ride, and finished with a run, one after the other. However, the Ironman is a long-distance version of this event, taking the whole day to complete, and Ironman Wales is one of the toughest courses in the world. Racing begins in the Pembrokeshire seaside town of Tenby at 7am in the morning with a 3.8km sea swim. A short dash into the transition area in the town and you set off on your bike for 180km of punishing hills. Once back into Tenby, cycling shorts are swapped for running shoes and it’s time to start the 42km marathon in and around the town. I completed this race 2 years ago in 15 hours and 6 minutes, but just had to come back to do it again, raising money for brainstrust in the process. Let me explain why.
I love cycling, and I love running, and with the sport of triathlon becoming increasingly popular, thanks to Great Britain’s success with the Brownlee brothers at the London Olympic games, I decided it was time to learn to swim and have a go. Now I am no Olympic athlete, that’s for sure, but after my first triathlon, I was hooked so signed up to Ironman Wales. After 18 months of training, I finished the 2013 race feeling rather proud of my achievement, and continued with my final year of medical school in London. With the excitement of that race becoming a distant memory, and my first year as a junior doctor in Liverpool looming, I pondered the idea of doing it all over again.
I took the plunge and signed up again for the 2015 race last Christmas. Training for such a big event has been much harder this time around, while juggling the demands of being a junior doctor.

So the weekend arrived at last. I drove down to Tenby with my father on Friday 11th September, and spent the following day registering for the race, packing my equipment into various bags to be picked up between the events in the transition area, and fixing last minute mechanical problems with the bike. A final meal, heavy on the carbs, with the family and it was time for bed. I must admit I get nervous before a big race. Months of preparation lead up to this one-day where you hope to execute your plan perfectly.
I tried to eat a bowel of porridge but it’s difficult to eat at 5am when you know what faces you throughout the day to come. I got my wetsuit on, drank a cup of coffee and walked to the transition area (where my bike gear, and running gear are stored). All 2000 competitors start the walk down to the beach at 6:15am. The sun has not yet come up, but you can read the emotion on everyone’s face. My fiancé is with me but I don’t say much. Once on the beach, I jump into the sea to get wet and warmed up, then head back behind the start line.
Everyone is silent, until the Welsh national anthem bellows out. If my wetsuit wasn’t so tight, I’m sure the hairs on my body would be standing up right now. I feel the waves of adrenaline rising up and prepare to hit the water. Bang… and we are off.
The swim course is a triangle heading out to the far left of the bay, turning around a floating buoy, then swimming along the bay, turning once more at the far right of the bay, then heading back to the beach. Once back on the beach, it’s a short run along the sand then the circuit must be swam for a second time to make up the 3.8km distance. The water was very choppy, and at times it felt like my efforts was getting me nowhere, but I exited the water after 1 hour and 26 minutes in a salty daze.
After running from the beach back to the transition area, I got my cycling gear on, grabbed my bike and headed out of Tenby. 180km of hills lay ahead. Each one saps a little bit more out of you, but the scenery is so stunning, I don’t pay attention to the pain. I force down energy gels and malt loaf every half an hour, trying to keep my energy up. The first 50km or so are reasonably flat, but I knew better than to push too hard, as I knew what was still to come. Towards the end of the bike course there are three big climbs and spectators line the streets. They are short and sharp. For one day only, you get the type of support one would only expect during the Tour de France race. There is literally enough space for only one rider to climb the hill due to the crowds willing us up. The feeling is fantastic. I arrive back in Tenby after 7 hours and 34 minutes on the bike, with a sore neck and back. I am optimistic that my legs will work on the marathon.
Heading out onto the run course I was feeling optimistic, although drained and sore. My legs were still working as I attempted to run. This is not the usual condition you would normally turn up for a marathon in. This is where Ironman gets tough. The course consists of four laps of just over 10km each, with each lap consisting of an uphill stretch out of Tenby, a downhill stretch heading back into town collecting a coloured band on the way down, and the remainder of each lap snaking through the narrow streets of the town. Regular water and energy gel stops were strategically placed around the course.

I refused to stop going up those hills. As the night grew darker and the rain started to lash down on the final lap, I smiled to myself, knowing I was half an hour from the finish line. As I completed the last lap of the course, I turned left following the signs for the finish. A short run along the waterfront and the flashing lights, music and crowds of thousands of spectators lined the finishers’ carpet. A high five from my dad, and then I passed under the finish line once more.

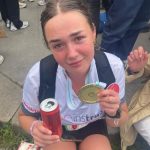
I finished the course in 14 hours and 46 minutes to collect my finishers’ medal, running the marathon 50 minutes quicker than 2 years before in 5 hours and 6 minutes. So far I have received generous donations in excess of 700 pounds and the money keeps rolling in.
I know it will be put to good use to support patients and their families.
I keep getting asked if I will do an Ironman race again, and my answer is … absolutely, it makes you feel alive!
If you, like Christopher, would like to take on a challenge for brainstrust, so that we can support more people in the UK to feel less afraid, less alone and more in control in the face of a terrifying brain tumour diagnosis, then we’ll help you with it every step of the way. Visit our team brainstrust page to pick one of our challenges or simply get in touch with tessa@brainstrust.org.uk if you’d like to plan one of your own.


