In Charity News, Do your own thing

Time to travel?

This Brain Tumour Awareness Month, Hayley has shared her story with us. Since her diagnosis aged 21, she’s been determined to not let her brain tumour stop her getting on some amazing adventures.

“I didn’t have headaches”

Hayley’s brain tumour diagnosis came as a total shock.  At the age of just 21, she began vomiting up to sixty times a day, a situation that became pretty miserable pretty quickly. Although this was a clear sign that something wasn’t right with her health, Hayley didn’t imagine for one moment that this would eventually lead to the diagnosis of a brain tumour.

“I didn’t have headaches or seizures or any of the symptoms that you might expect” says Hayley, who was initially diagnosed with suspected Vomiting Epilepsy.  When a scan revealed a grade one Ganglioglioma, Hayley was naturally shocked and terrified.

“You can’t just leave me!”

The recommended treatment plan was watch and wait, leaving Hayley with the knowledge that she was now living with a brain tumour, and offering her no relief at all from her symptoms.  The continual vomiting had by now become completely debilitating, and she remembers saying to the neurosurgeon “But you can’t just leave me like this!”

It was at this stage that Hayley got in touch with brainstrust. We funded a second opinion for her with a neurosurgeon specialising in this area.  This surgeon agreed to carry out elective surgery for Hayley, and the tumour was completely removed.

Hayley simply says: “I don’t know what would have happened to me without brainstrust.” 

“I’m going to drive around the world”

Following her operation in September 2014, things were certainly not all plain sailing for Hayley, and it took over a year for her to reach a vague sense of a new normal. “I can remember medical staff saying to me prior to my operation “Oh, there’ll be a [post-operative] recovery period” in the sort of casual manner one might say “Oh, we’ll have a cup of tea in a moment”. I was under the impression that ‘recovery period’ was the term people used to get a couple of extra days off of work post-surgery. I couldn’t have been more wrong.” A self-confessed geek, Hayley was devastated to find that her ability to learn and remember new things had been significantly impaired since her surgery. Having been halfway through her university course at the time of her treatment, she had to come to terms with abandoning her degree when she found she could no longer take in the information during her lectures. On top of this, she would now be without a driving licence for sixteen months, making 2015 a particularly frustrating and challenging year for her.

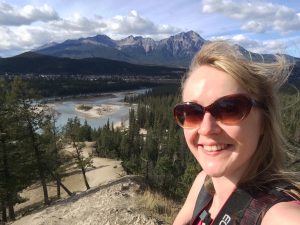
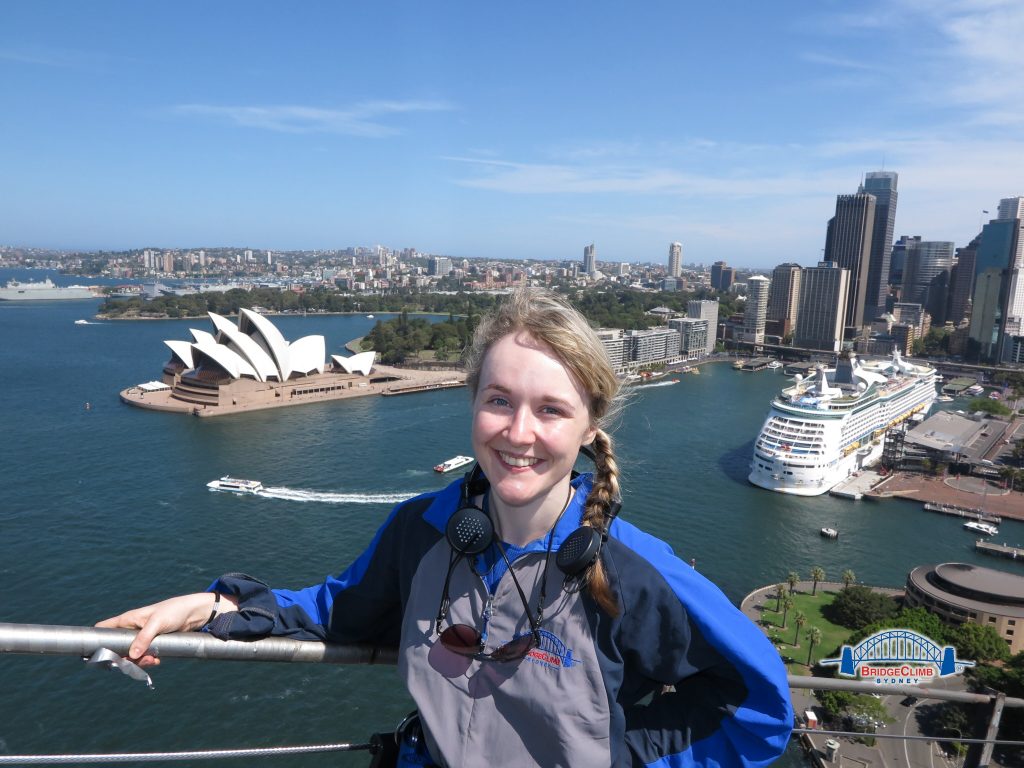
The reinstatement of her driving licence in January 2016 seemed like an occasion worthy of celebration, and so Hayley decided to celebrate by driving around the world.  As you do.  September 2016 – January 2017 were spent driving across Canada, America, Hawaii and Australia, followed by a second trip around Ireland and Northern Ireland in May 2017. “I couldn’t comfortably walk far on these adventures because the surgery had left me very sensitive to walking on hard surfaces, but I could finally drive again.”

“If I’m going to potentially snuff it early, I might as well do it with a smile on my face!”

When Hayley returned from her driving adventures having been well and truly bitten by the travelling bug, she attended a talk on brain tumours.  At this event, the speaker informed the audience that Hayley’s type of tumour often recurred, and that in this scenario the tumour might well act more aggressively.  “Well”, declared Hayley on returning home from the event, “If I’m going to potentially snuff it early, I might as well do it with a smile on my face”.  And so began Project British Isles.

Did you know that there are 250 British Isles?  No, me neither.  There are more than that if you count the ones that are less than 0.5 miles square, but Hayley isn’t counting those ones towards her total, unless there is something particularly interesting about them.  She has decided to visit them all, and so spent a significant chunk of 2018 driving around the British Coastline, catching boats out to islands and sleeping in her Seat Ibiza.  So far, she’s ticked off 81 islands, with a remaining 39 English, 118 Scottish and 12 Welsh isles to go.  She’s had many adventures along the way, and planning is well underway for the upcoming 2019 trips.

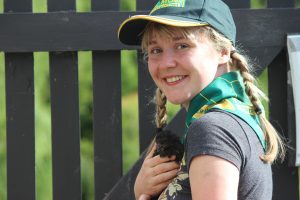
Hayley has also recently completed the Gold Duke of Edinburgh’s Award and the Queen’s Scout Award.  She loves animals, and has successfully re-introduced hedgehogs back into her village for the volunteering section of her awards.

Building a brain tumour community in Essex

When she’s not travelling around Britain sleeping in her car or creating hedgehog refuges, Hayley lives in Essex.  Although still living with her own challenges as a direct result of her brain tumour and treatment, Hayley reaches out to try to support others in a similar situation.

Hayley is now working closely with brainstrust’s Support Specialist for London and the South East to build a community for patients and carers by helping to organise meetups and workshops in the area.  She has also created a closed Facebook group for patients and carers in Essex to connect with one another for mutual support.

Please do get in touch with us if you’d like to attend a meetup in the Essex area as we’d love to hear from you.

Email: jane@brainstrust.org.uk

You can join the Essex Facebook group here, or just search ‘Mid-Essex Brain Tumour Support Group’.

charity donationimg 6267

Introduction

The Brain Tumour Data Dashboard lets you explore up -to-date, population level data about the brain tumours diagnosed in England between 2013 and 2015. Using the drop down menus on the left you can select different groups of patients to view in the charts below. In these charts the number of patients for every 100 diagnoses is displayed as images of people. Patients have been grouped by date of diagnosis, type of tumour, age, gender, and region in England.

For each group of patients you can explore the different routes to diagnosis, the proportion of those who received chemotherapy or radiotherapy, as well as the survival of the patients within each group. For more information about what these metrics mean please see the glossary.

How to use

  1. Select the year of diagnosis using the drop down menu.
  2. Select your patient group of interest from the four drop down menus in the following order:
    1. Tumour group
    2. Age at diagnosis
    3. Region of England
    4. Gender of patient
  3. To view a second chart to compare different groups of patients, click the ‘compare’ button.The second chart will appear below the first chart.

*Note that the tool is best used on a laptop or tablet rather than a mobile phone*

Unavailable data

Some of the data in these charts is not available.There are two main reasons for this:

  1. How the data has been grouped

If you cannot select a patient group from the drop down menus, the data is unavailable because of how the data has been organised.

Public Health England has grouped the data like a branching tree. The bottom of the tree contains all the patients with brain tumours, and then each branch divides the data by a certain characteristics, like age, or location of tumour. But the data is divided in an order, starting with location of the tumour (endocrine or brain), then by age, region, and gender. Age is at the start because it makes a bigger difference to survival rates and treatment rates than gender or region. Sometimes, after the data has been split by type of tumour and age, there is not enough data to be split again. This is because to protect patient confidentiality groups cannot contain less than 100 patients. Because some groups cannot be split further, you cannot create ‘totals’ for everyone by region or gender. For example, you cannot see results for all ages by region, or all brain tumours by gender. If these totals were calculated and released, it might be possible to identify patients, which is why Public Health England cannot release this data.

  1. Statistical reasons and data availability

If you can select a patient group from the chart menus, but the chart does not display, the data is unavailable for one of several reasons:

  1. Data is not yet available for the selected year from Public Health England.
  2. Data is not available because the data quality is too poor to release this statistic.
  3. Data is not available as the statistic is not appropriate for this group.
  4. Data is not available because the standard error of the estimate was greater than 20% and so the estimate has been supressed.

Up to date brain tumour data

Brain tumour data may influence the decisions you make about your care. Data also helps you understand the bigger picture, or landscape, in which you find yourself.

Brain tumour data and statistics influence the focus, and work of organisations like brainstrust. The information helps us to understand the scale and impact of the problems we are setting out to solve.

This tool helps you understand the landscape in which you find yourself having been diagnosed with a brain tumour. This landscape can be particularly tricky to navigate as there are many different types of brain tumour, all of which have a different impact.

The information you see represents the most up-to-date, official, population level brain tumour data available for England. Over time we will be adding to the brain tumour data available and publishing reports, with recommendations, as a result of what we learn from this data.

The data behind this content has come from Public Health England’s National Cancer Registration and Analysis Service (NCRAS) and is a direct result of the ‘Get Data Out’ project.

This project provides anonymised population level brain tumour data for public use in the form of standard output tables, accessible here: http://cancerdata.nhs.uk/standardoutput

Incidence

The number or rate (per head of population) of new cases of a disease diagnosed in a given population during a specified time period (usually a calendar year). The crude rate is the total number of cases divided by the mid-year population, usually expressed per 100,000 population.

Malignant

Malignant tumours which grow by invasion into surrounding tissues and have the ability to metastasise to distant sites

Mortality

The number or rate (per head of population) of deaths in a given population during a specified time period (usually a calendar year). The crude rate is the total number of deaths divided by the mid-year population, usually expressed per 100,000 population.

Non-malignant

Not cancerousNon-malignant tumours may grow larger but do not spread to other parts of the body.

Survival

The length of time from the date of diagnosis for a disease, such as cancer, that patients diagnosed with the disease are still alive. In a clinical trial, measuring the survival is one way to see how well a new treatment works. Also called ‘overall survival’ or ‘OS’.

Routes to Diagnosis

Under the ‘Routes to Diagnosis’ tab in the Brain Tumour Data Dashboard, you can explore the ways patients have been diagnosed with brain tumours. There are many ways, or routes, for cancers to be diagnosed in the NHS. A ‘route to diagnosis’ is the series of events between a patient and the healthcare system that leads to a diagnosis of cancer. The routes include:

  1. Two Week Wait

Patients are urgently referred by their GP for suspected cancer via the Two Week Wait system and are seen by a specialist within 2 weeks where they are diagnosed.

  1. GP referral

Diagnosis via a GP referral includes routine and urgent referrals where the patient was not referred under the Two Week Wait system.

  1. Emergency Presentation

Cancers can be diagnosed via emergency situations such as via A&E, emergency GP referral, emergency transfer or emergency admission.

  1. Outpatient

Outpatient cancer diagnoses include diagnoses via an elective route which started with an outpatient appointment that is either a self-referral or consultant to consultant referral. (It does not include those under the Two Week Wait referral system).

  1. Inpatient elective

Diagnosis via an inpatient elective route is where diagnosis occurs after the patient has been admitted into secondary care from a waiting list, or where the admission is booked or planned.

  1. Death Certificate Only

Diagnoses made by Death Certificate Only are made where there is no more information about the cancer diagnosis other than the cancer related death notifications. The date of diagnosis is the same as that of the date of death.

  1. Unknown

For some patients with a cancer diagnosis, there is no relevant data available to understand the route to diagnosis.


More information

If any of the statistical terms in this section of the brainstrust website are hard to understand, we recommend looking them up here:

Cancer Research UK’s Cancer Statistics Explained

http://www.cancerresearchuk.org/health-professional/cancer-statistics/cancer-stats-explained/statistics-terminology-explained#heading-Seven

If you are looking for help understanding terms relating specifically to brain tumours, and treatment, then the brainstrust glossary is available here:

https://www.brainstrust.org.uk/advice-glossary.php