In Fundraising, Fundraising News

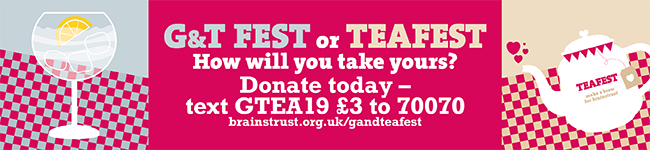
Last week, people up and down the country got together to celebrate TEAFEST and G&T Fest.

Whether they were enjoying a cuppa, a G&T, or something else entirely – last week our community got together to show people affected by a brain tumour that they aren’t alone. Our team were lucky enough to attend a few of the events. Read on to see what they got up to! You can still donate to the campaign on our website, or using the text code below.


A TeaFest Meetup in Leeds – Tuesday 19 February

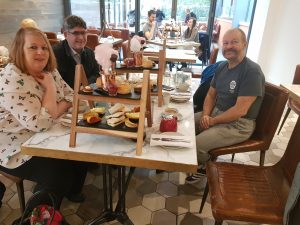
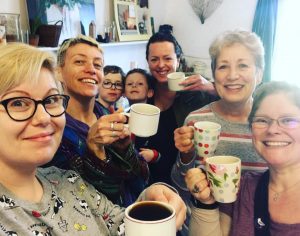
Aisha held a Meetup at Weetwood Hall in Leeds to catch up with her community:

We arranged an afternoon tea for patients and carers in and around the Leeds area.  While enjoying tea, sandwiches and jam and cream scones, we found that patients were able to share experiences of their brain tumour journey.  Though the grades and types of tumours are different the thing in common is knowing that there is someone else in a similar position that you who ‘get’s it’.

We have lots of Meetups coming up – find one near you here.


UCL Teafest event- Wednesday 20 February

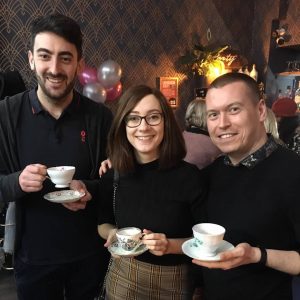
Support Specialist Jodie headed into London to attend a TEAFEST event put on by the UCL Tea Society, to give a talk about the work that we do:

This Teafest, members of UCL’s Tea Society held an awareness event to help spread the word about brainstrust and the importance of supporting people living with a brain tumour diagnosis. As well the Tea Society, the University’s Cancer Charity Alliance Society, and the Mental Health Society also took part in the event. 

The evening gave people an opportunity to hear about the work of brainstrust and why fundraising events such as Teafest are so important. Biochemistry students from the University also gave a talk about brain tumour diagnosis and treatments. 

A big thank you to the UCL Tea Society for organising this event on behalf of brainstrust.


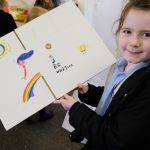
A TeaFest get together in Maidstone – Thursday 21 February

The wonderful Dickenson family, who are also taking part in Follow the Seagulls this April, hosted a TeaFest event, attended by our Support Specialist Jane. Guest of honour at the Dickenson’s TeaFest event was little Seth, 5, who spent most of last year receiving treatment for a medulloblastoma.  Friends and family of the Dickensons came together for their TeaFest celebration at the beautiful location of Blooming Green flowers in Linton, Maidstone.  The grown ups enjoyed tea, coffee and cake, while the children enjoyed lots of cake and lots of running around outside amongst the flowers in the unseasonably warm February weather.  A good time was had by all and £135 raised to support people living with a brain tumour diagnosis.


G&T Fest at Tailors Gin Bar – Thursday 21 February

The brainstrust team based in Leeds headed to Tailors Gin Bar, who put on a fantastic G&T filled event. They had free samples of Teetotal G&T for those not drinking alcohol, and Tailor’s also created a special brainstrust bramble for the evening, donating a percentage of the profits from each drink sold. There was a raffle too, for those who wanted the chance to win a bottle of Tailor’s own gin (most people there!)

It was a fantastic evening in which people came together and showed their support for people affected by a brain tumour and for the team to meet our community here in Leeds – thank you to Tailor’s for your support.


A huge thank you to everyone that took part in TEAFEST and G&T Fest, and to those who are doing events in the future. We wish we could have attended every event, and we’re looking forward to sharing some more photos with the community. Whether you’ve organised an event yourself, donated the cost of your morning cuppa or attended an event, you’re supporting the 60,000 people in the UK living with a brain tumour.

If you’ve got a fundraising idea, or would like to get involved in another way, we’d love to hear from you! Please email hello@brainstrust.org.uk


20181218 145418 e1545406788723dscf8222

Introduction

The Brain Tumour Data Dashboard lets you explore up -to-date, population level data about the brain tumours diagnosed in England between 2013 and 2015. Using the drop down menus on the left you can select different groups of patients to view in the charts below. In these charts the number of patients for every 100 diagnoses is displayed as images of people. Patients have been grouped by date of diagnosis, type of tumour, age, gender, and region in England.

For each group of patients you can explore the different routes to diagnosis, the proportion of those who received chemotherapy or radiotherapy, as well as the survival of the patients within each group. For more information about what these metrics mean please see the glossary.

How to use

  1. Select the year of diagnosis using the drop down menu.
  2. Select your patient group of interest from the four drop down menus in the following order:
    1. Tumour group
    2. Age at diagnosis
    3. Region of England
    4. Gender of patient
  3. To view a second chart to compare different groups of patients, click the ‘compare’ button.The second chart will appear below the first chart.

*Note that the tool is best used on a laptop or tablet rather than a mobile phone*

Unavailable data

Some of the data in these charts is not available.There are two main reasons for this:

  1. How the data has been grouped

If you cannot select a patient group from the drop down menus, the data is unavailable because of how the data has been organised.

Public Health England has grouped the data like a branching tree. The bottom of the tree contains all the patients with brain tumours, and then each branch divides the data by a certain characteristics, like age, or location of tumour. But the data is divided in an order, starting with location of the tumour (endocrine or brain), then by age, region, and gender. Age is at the start because it makes a bigger difference to survival rates and treatment rates than gender or region. Sometimes, after the data has been split by type of tumour and age, there is not enough data to be split again. This is because to protect patient confidentiality groups cannot contain less than 100 patients. Because some groups cannot be split further, you cannot create ‘totals’ for everyone by region or gender. For example, you cannot see results for all ages by region, or all brain tumours by gender. If these totals were calculated and released, it might be possible to identify patients, which is why Public Health England cannot release this data.

  1. Statistical reasons and data availability

If you can select a patient group from the chart menus, but the chart does not display, the data is unavailable for one of several reasons:

  1. Data is not yet available for the selected year from Public Health England.
  2. Data is not available because the data quality is too poor to release this statistic.
  3. Data is not available as the statistic is not appropriate for this group.
  4. Data is not available because the standard error of the estimate was greater than 20% and so the estimate has been supressed.

Up to date brain tumour data

Brain tumour data may influence the decisions you make about your care. Data also helps you understand the bigger picture, or landscape, in which you find yourself.

Brain tumour data and statistics influence the focus, and work of organisations like brainstrust. The information helps us to understand the scale and impact of the problems we are setting out to solve.

This tool helps you understand the landscape in which you find yourself having been diagnosed with a brain tumour. This landscape can be particularly tricky to navigate as there are many different types of brain tumour, all of which have a different impact.

The information you see represents the most up-to-date, official, population level brain tumour data available for England. Over time we will be adding to the brain tumour data available and publishing reports, with recommendations, as a result of what we learn from this data.

The data behind this content has come from Public Health England’s National Cancer Registration and Analysis Service (NCRAS) and is a direct result of the ‘Get Data Out’ project.

This project provides anonymised population level brain tumour data for public use in the form of standard output tables, accessible here: http://cancerdata.nhs.uk/standardoutput

Incidence

The number or rate (per head of population) of new cases of a disease diagnosed in a given population during a specified time period (usually a calendar year). The crude rate is the total number of cases divided by the mid-year population, usually expressed per 100,000 population.

Malignant

Malignant tumours which grow by invasion into surrounding tissues and have the ability to metastasise to distant sites

Mortality

The number or rate (per head of population) of deaths in a given population during a specified time period (usually a calendar year). The crude rate is the total number of deaths divided by the mid-year population, usually expressed per 100,000 population.

Non-malignant

Not cancerousNon-malignant tumours may grow larger but do not spread to other parts of the body.

Survival

The length of time from the date of diagnosis for a disease, such as cancer, that patients diagnosed with the disease are still alive. In a clinical trial, measuring the survival is one way to see how well a new treatment works. Also called ‘overall survival’ or ‘OS’.

Routes to Diagnosis

Under the ‘Routes to Diagnosis’ tab in the Brain Tumour Data Dashboard, you can explore the ways patients have been diagnosed with brain tumours. There are many ways, or routes, for cancers to be diagnosed in the NHS. A ‘route to diagnosis’ is the series of events between a patient and the healthcare system that leads to a diagnosis of cancer. The routes include:

  1. Two Week Wait

Patients are urgently referred by their GP for suspected cancer via the Two Week Wait system and are seen by a specialist within 2 weeks where they are diagnosed.

  1. GP referral

Diagnosis via a GP referral includes routine and urgent referrals where the patient was not referred under the Two Week Wait system.

  1. Emergency Presentation

Cancers can be diagnosed via emergency situations such as via A&E, emergency GP referral, emergency transfer or emergency admission.

  1. Outpatient

Outpatient cancer diagnoses include diagnoses via an elective route which started with an outpatient appointment that is either a self-referral or consultant to consultant referral. (It does not include those under the Two Week Wait referral system).

  1. Inpatient elective

Diagnosis via an inpatient elective route is where diagnosis occurs after the patient has been admitted into secondary care from a waiting list, or where the admission is booked or planned.

  1. Death Certificate Only

Diagnoses made by Death Certificate Only are made where there is no more information about the cancer diagnosis other than the cancer related death notifications. The date of diagnosis is the same as that of the date of death.

  1. Unknown

For some patients with a cancer diagnosis, there is no relevant data available to understand the route to diagnosis.


More information

If any of the statistical terms in this section of the brainstrust website are hard to understand, we recommend looking them up here:

Cancer Research UK’s Cancer Statistics Explained

http://www.cancerresearchuk.org/health-professional/cancer-statistics/cancer-stats-explained/statistics-terminology-explained#heading-Seven

If you are looking for help understanding terms relating specifically to brain tumours, and treatment, then the brainstrust glossary is available here:

https://www.brainstrust.org.uk/advice-glossary.php