In Charity News, Uncategorized

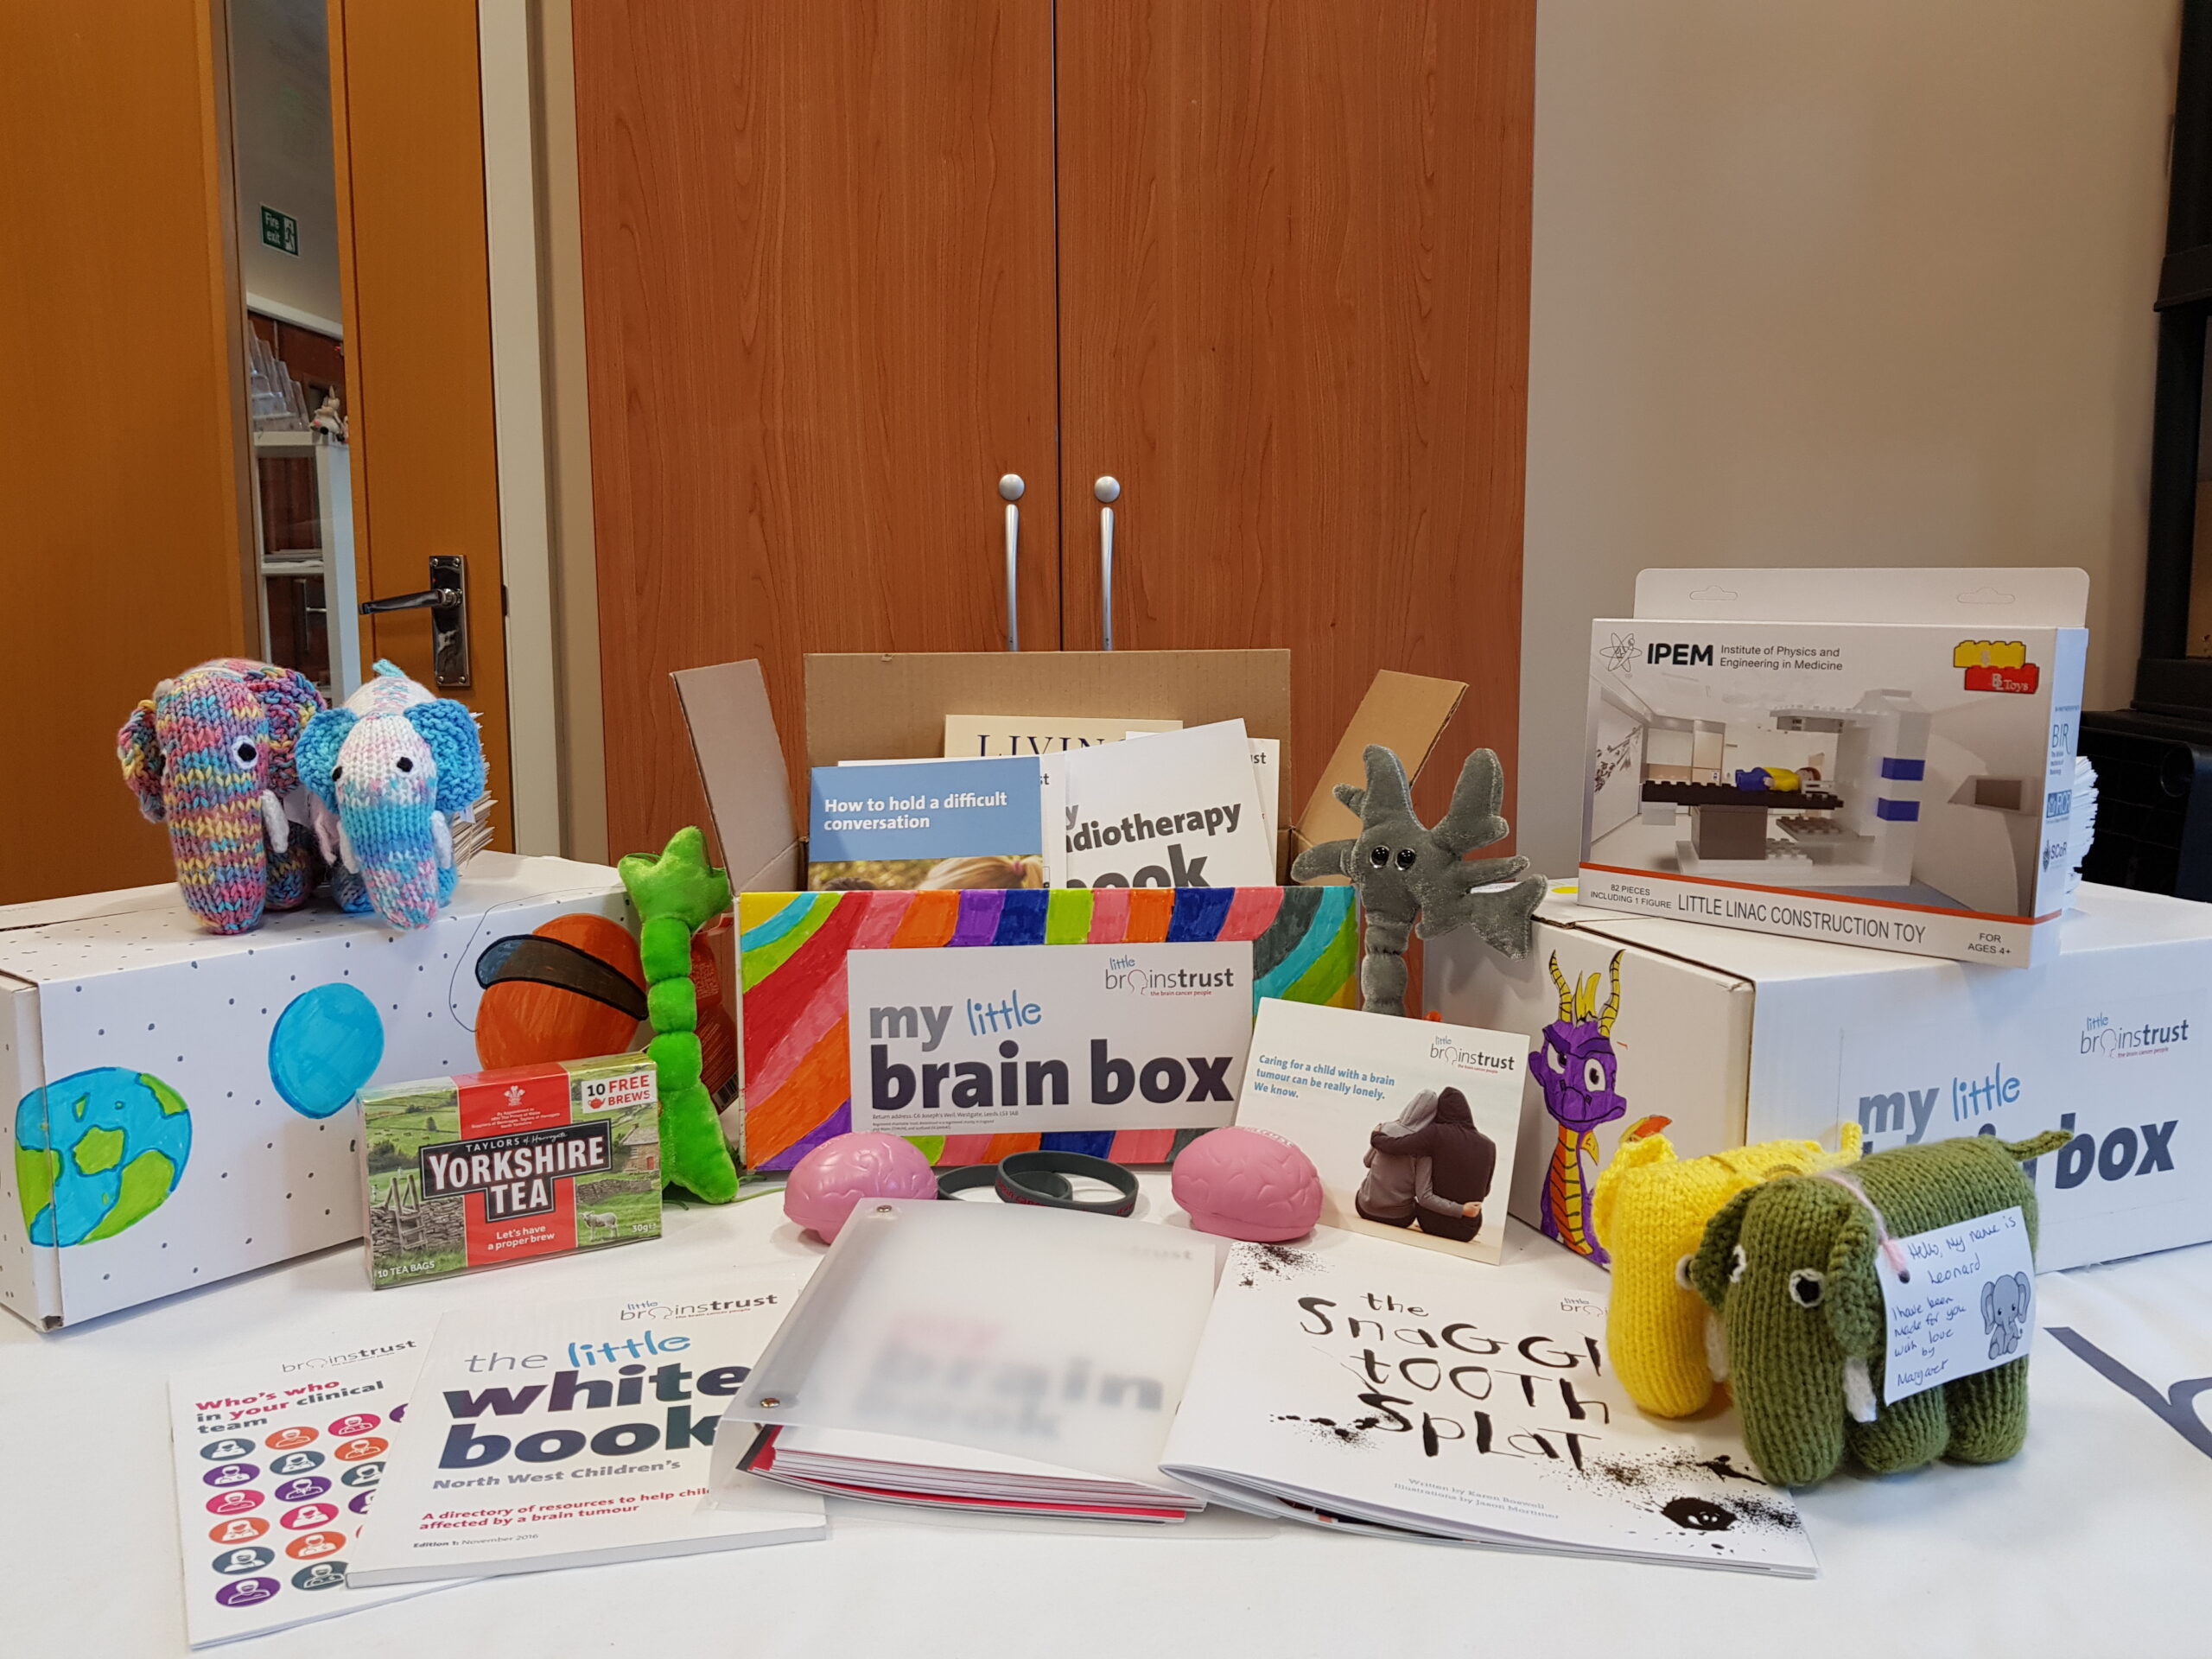
The Little brainstrust brain box project

A Yorkshire primary school have teamed up with little brainstrust to help with a brain box project. 30 Key Stage 2 pupils helped to decorate brain boxes that will be sent out to children diagnosed with a brain tumour.

500 children are diagnosed with a brain tumour every year in the UK. When a child is diagnosed, it impacts the whole family. Little brainstrust tailor each brain box specifically to the family who requested it, and the box is filled with carefully chosen resources best suited for the whole family. A brain box is an invaluable toolkit of information to help families feel well-resourced at an incredibly confusing and isolating time.

Russell Hall pupils support their classmate

In autumn, Little brainstrust launched a project, and asked schools to help decorate some brain boxes. When the opportunity arose to partner Little brainstrust as part of this project, Russell Hall Primary School jumped at the chance. The school, based in Queensbury, West Yorkshire, know only too well how a brain tumour diagnosis can affect the life of a child and their family. Amelia, a student at the school, was diagnosed with a brain tumour in early 2018.

Vicky Robinson, Amelia’s mum, said ‘When I heard that Little brainstrust were asking for schools to be involved in their brain box project, I knew 

instantly that Amelia’s school would like to get involved. The school have been a constant source of support for us whilst dealing with Amelia’s diagnosis and subsequent treatment. Everyone has been rooting for Amelia and have all welcomed her back to school with such care and compassion.’

When Amelia’s family received their brain box, it was a real help. ‘The brain box was gratefully received when we found out Amelia had a brain tumour, and it made us feel like we weren’t alone. Having the children at her school decorate the boxes for other children and parents to receive was amazing. Thank you to the children who took great care in decorating the boxes, they have put such care into thinking about making other children in Amelia’s position happy. I want to thank Little brainstrust and all the staff, parents and children of Russell Hall Primary School for all of the support they have given us, we are truly grateful’

‘A practical way to show our support’

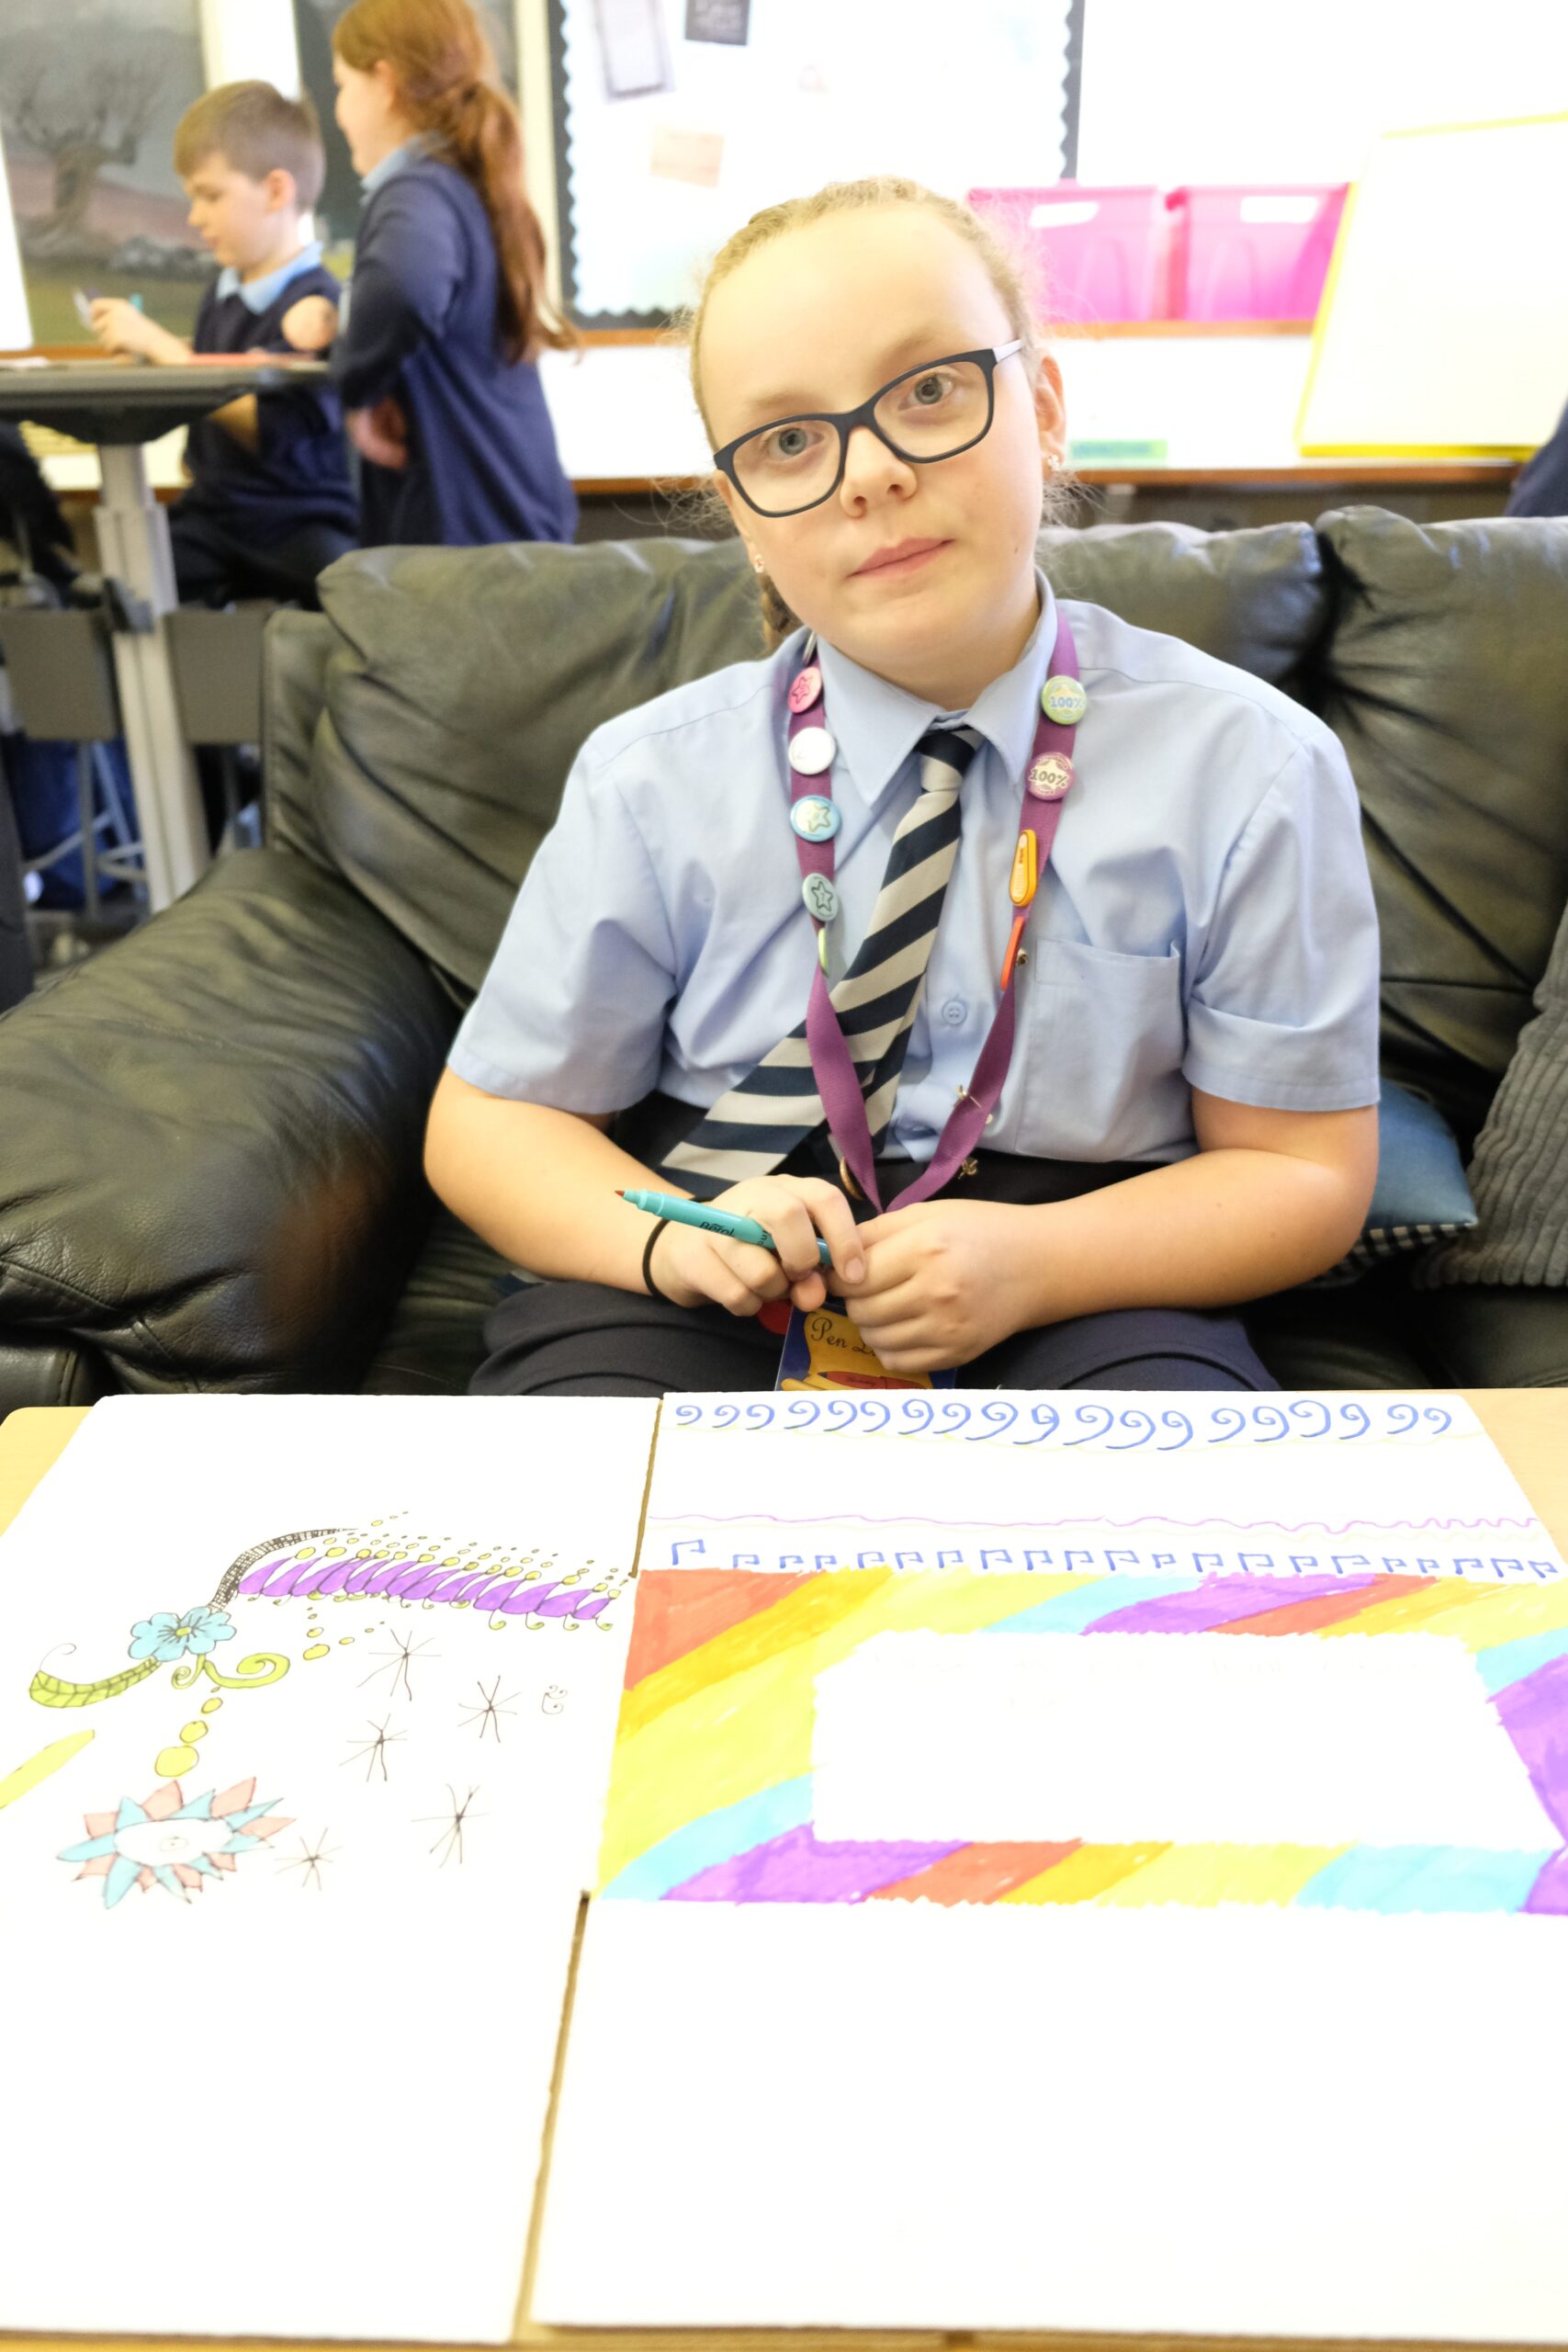
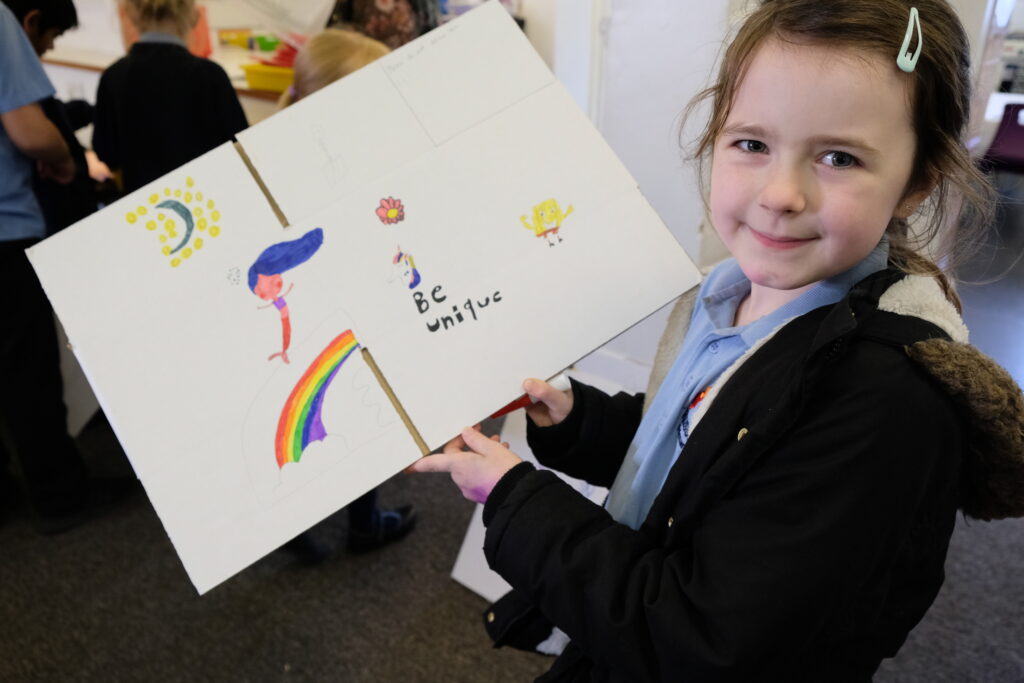
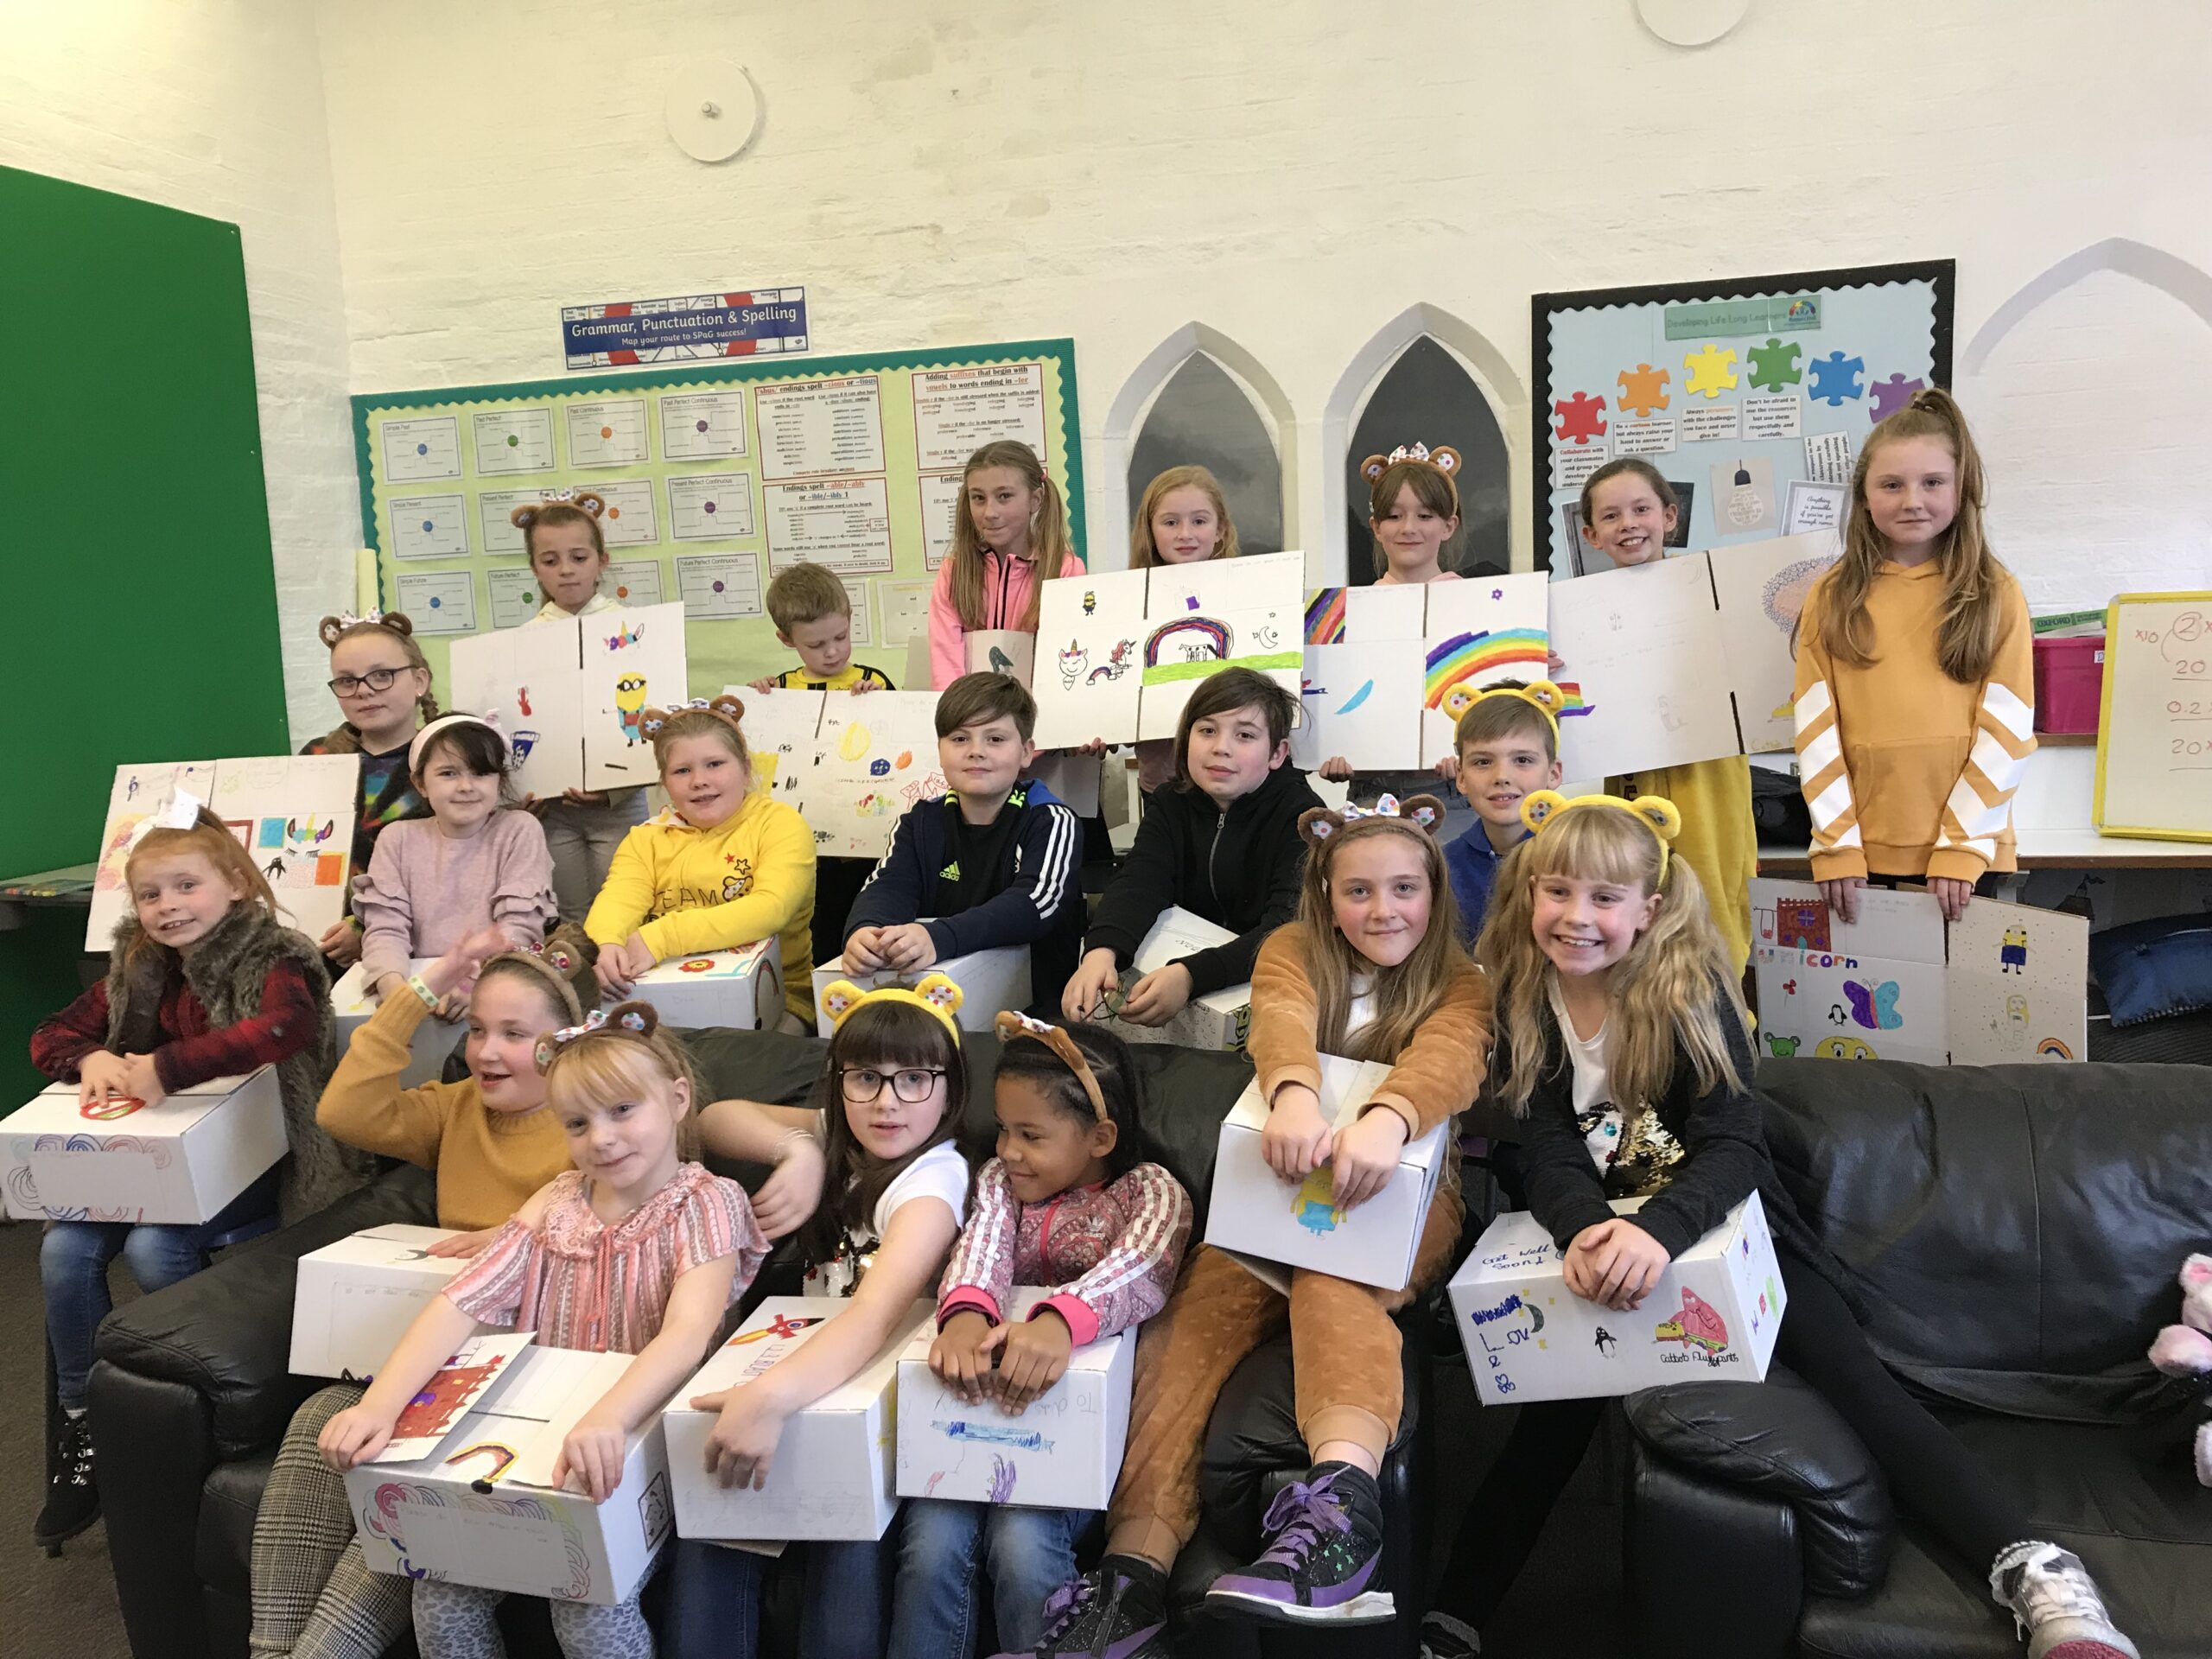
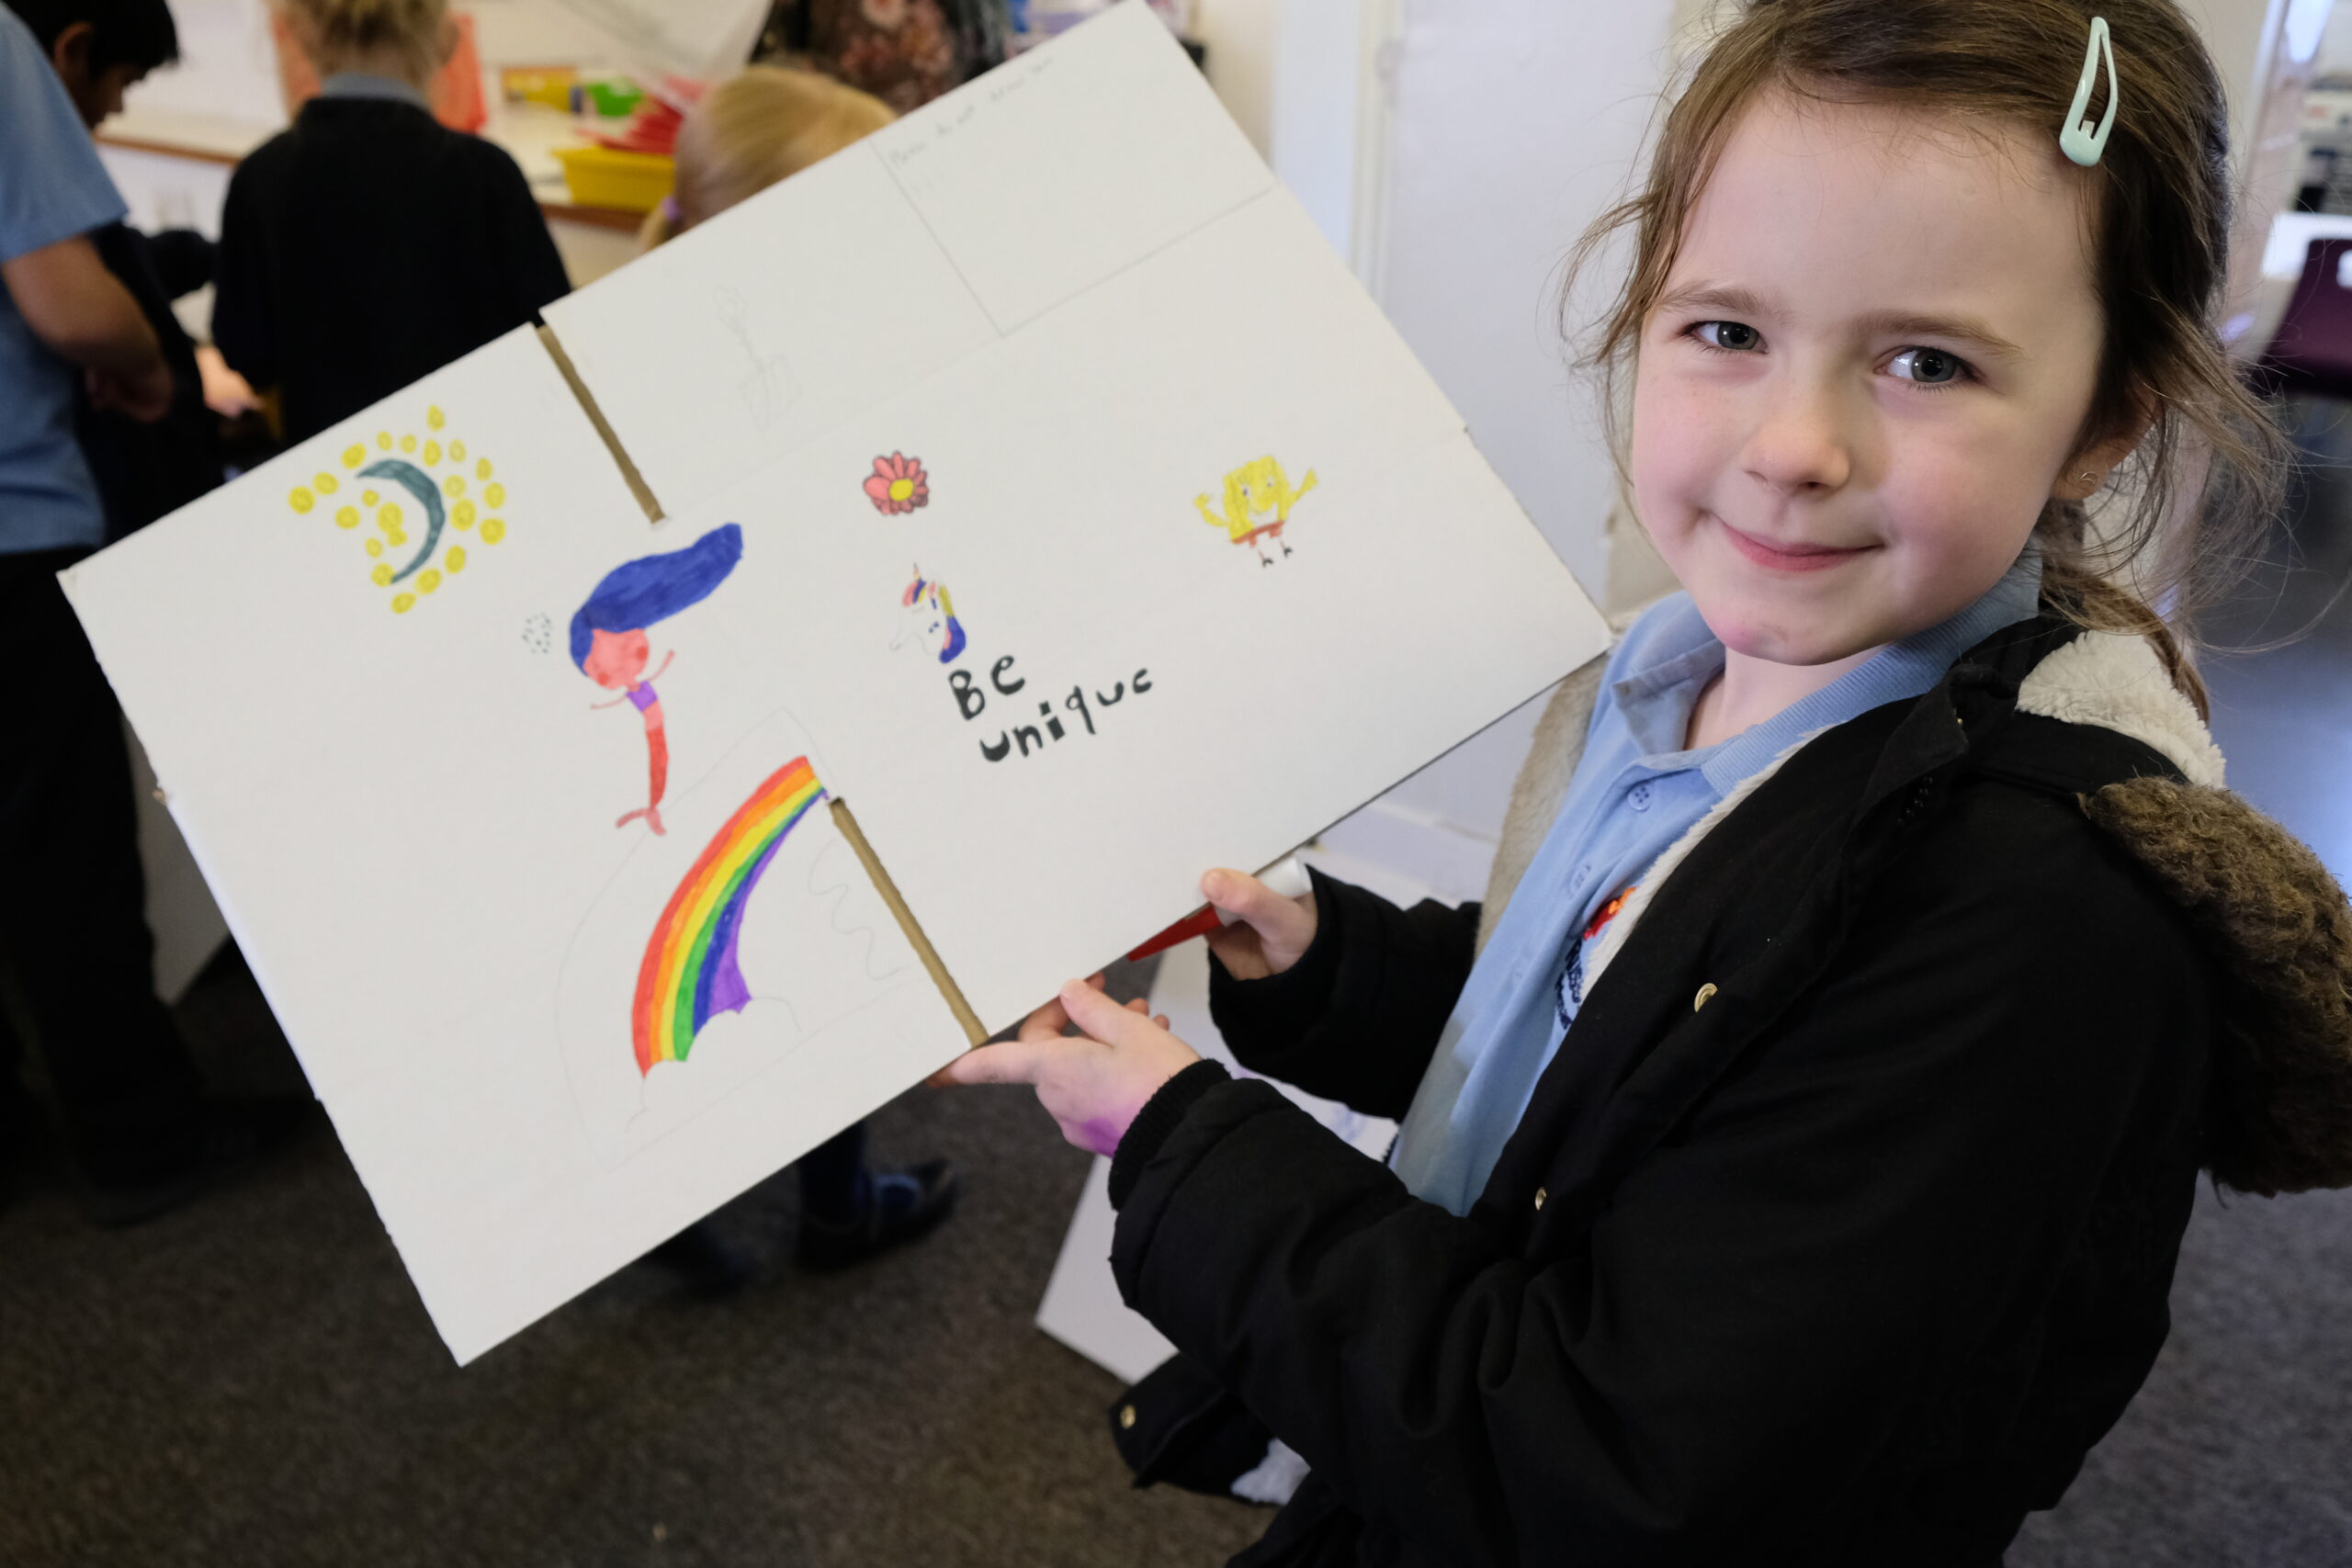
From 5th-16th November 2018, pupils kindly gave up 30 mins of their lunchtime each day to decorate the brain boxes with drawings of characters such as Harry Potter, SpongeBob SquarePants and The Simpsons.

Russell Hall’s Headteacher Andrea Grist said ‘When Little brainstrust approached us to see if we would like to be involved in the brain box project, I instantly agreed. We wanted to show our support for Amelia and her family by doing something practical. It gave us a chance to talk to the children in school about Amelia’s condition and within a day I had 30 volunteers to join the brain box club. I know from personal experience how important it is to get the right support and information when a family member is diagnosed with a serious condition, as my husband was diagnosed with a brain tumour 18 months ago. I hope that the decorated brain boxes bring a little bit of joy and a lot of hope to families at such a difficult time’


Thanks to the children at Russell Hall Primary School, children coming to terms with a brain tumour diagnosis across the UK will receive these brightly and brilliantly decorated brain boxes. As well as providing a brain box, Little brainstrust support children and their families by offering continuous support over the phone or email. We offer a listening ear for families to talk freely. Little brainstrust recognises that families give invaluable support to each other and for this reason, we love to organise family days our for everyone to have a day out on Little brainstrust. Keep an eye on our Meetup website for upcoming events.

52914061 10156926625093516 7287664614811107328 nsiemens healthineers logo

Introduction

The Brain Tumour Data Dashboard lets you explore up -to-date, population level data about the brain tumours diagnosed in England between 2013 and 2015. Using the drop down menus on the left you can select different groups of patients to view in the charts below. In these charts the number of patients for every 100 diagnoses is displayed as images of people. Patients have been grouped by date of diagnosis, type of tumour, age, gender, and region in England.

For each group of patients you can explore the different routes to diagnosis, the proportion of those who received chemotherapy or radiotherapy, as well as the survival of the patients within each group. For more information about what these metrics mean please see the glossary.

How to use

  1. Select the year of diagnosis using the drop down menu.
  2. Select your patient group of interest from the four drop down menus in the following order:
    1. Tumour group
    2. Age at diagnosis
    3. Region of England
    4. Gender of patient
  3. To view a second chart to compare different groups of patients, click the ‘compare’ button.The second chart will appear below the first chart.

*Note that the tool is best used on a laptop or tablet rather than a mobile phone*

Unavailable data

Some of the data in these charts is not available.There are two main reasons for this:

  1. How the data has been grouped

If you cannot select a patient group from the drop down menus, the data is unavailable because of how the data has been organised.

Public Health England has grouped the data like a branching tree. The bottom of the tree contains all the patients with brain tumours, and then each branch divides the data by a certain characteristics, like age, or location of tumour. But the data is divided in an order, starting with location of the tumour (endocrine or brain), then by age, region, and gender. Age is at the start because it makes a bigger difference to survival rates and treatment rates than gender or region. Sometimes, after the data has been split by type of tumour and age, there is not enough data to be split again. This is because to protect patient confidentiality groups cannot contain less than 100 patients. Because some groups cannot be split further, you cannot create ‘totals’ for everyone by region or gender. For example, you cannot see results for all ages by region, or all brain tumours by gender. If these totals were calculated and released, it might be possible to identify patients, which is why Public Health England cannot release this data.

  1. Statistical reasons and data availability

If you can select a patient group from the chart menus, but the chart does not display, the data is unavailable for one of several reasons:

  1. Data is not yet available for the selected year from Public Health England.
  2. Data is not available because the data quality is too poor to release this statistic.
  3. Data is not available as the statistic is not appropriate for this group.
  4. Data is not available because the standard error of the estimate was greater than 20% and so the estimate has been supressed.

Up to date brain tumour data

Brain tumour data may influence the decisions you make about your care. Data also helps you understand the bigger picture, or landscape, in which you find yourself.

Brain tumour data and statistics influence the focus, and work of organisations like brainstrust. The information helps us to understand the scale and impact of the problems we are setting out to solve.

This tool helps you understand the landscape in which you find yourself having been diagnosed with a brain tumour. This landscape can be particularly tricky to navigate as there are many different types of brain tumour, all of which have a different impact.

The information you see represents the most up-to-date, official, population level brain tumour data available for England. Over time we will be adding to the brain tumour data available and publishing reports, with recommendations, as a result of what we learn from this data.

The data behind this content has come from Public Health England’s National Cancer Registration and Analysis Service (NCRAS) and is a direct result of the ‘Get Data Out’ project.

This project provides anonymised population level brain tumour data for public use in the form of standard output tables, accessible here: http://cancerdata.nhs.uk/standardoutput

Incidence

The number or rate (per head of population) of new cases of a disease diagnosed in a given population during a specified time period (usually a calendar year). The crude rate is the total number of cases divided by the mid-year population, usually expressed per 100,000 population.

Malignant

Malignant tumours which grow by invasion into surrounding tissues and have the ability to metastasise to distant sites

Mortality

The number or rate (per head of population) of deaths in a given population during a specified time period (usually a calendar year). The crude rate is the total number of deaths divided by the mid-year population, usually expressed per 100,000 population.

Non-malignant

Not cancerousNon-malignant tumours may grow larger but do not spread to other parts of the body.

Survival

The length of time from the date of diagnosis for a disease, such as cancer, that patients diagnosed with the disease are still alive. In a clinical trial, measuring the survival is one way to see how well a new treatment works. Also called ‘overall survival’ or ‘OS’.

Routes to Diagnosis

Under the ‘Routes to Diagnosis’ tab in the Brain Tumour Data Dashboard, you can explore the ways patients have been diagnosed with brain tumours. There are many ways, or routes, for cancers to be diagnosed in the NHS. A ‘route to diagnosis’ is the series of events between a patient and the healthcare system that leads to a diagnosis of cancer. The routes include:

  1. Two Week Wait

Patients are urgently referred by their GP for suspected cancer via the Two Week Wait system and are seen by a specialist within 2 weeks where they are diagnosed.

  1. GP referral

Diagnosis via a GP referral includes routine and urgent referrals where the patient was not referred under the Two Week Wait system.

  1. Emergency Presentation

Cancers can be diagnosed via emergency situations such as via A&E, emergency GP referral, emergency transfer or emergency admission.

  1. Outpatient

Outpatient cancer diagnoses include diagnoses via an elective route which started with an outpatient appointment that is either a self-referral or consultant to consultant referral. (It does not include those under the Two Week Wait referral system).

  1. Inpatient elective

Diagnosis via an inpatient elective route is where diagnosis occurs after the patient has been admitted into secondary care from a waiting list, or where the admission is booked or planned.

  1. Death Certificate Only

Diagnoses made by Death Certificate Only are made where there is no more information about the cancer diagnosis other than the cancer related death notifications. The date of diagnosis is the same as that of the date of death.

  1. Unknown

For some patients with a cancer diagnosis, there is no relevant data available to understand the route to diagnosis.


More information

If any of the statistical terms in this section of the brainstrust website are hard to understand, we recommend looking them up here:

Cancer Research UK’s Cancer Statistics Explained

http://www.cancerresearchuk.org/health-professional/cancer-statistics/cancer-stats-explained/statistics-terminology-explained#heading-Seven

If you are looking for help understanding terms relating specifically to brain tumours, and treatment, then the brainstrust glossary is available here:

https://www.brainstrust.org.uk/advice-glossary.php