In Brain News, Charity News, Press Releases, Uncategorized

brain tumour data logoMay 2018 sees the launch of the Brain Tumour Data Dashboard. This new tool has been designed to help you navigate and understand brain tumour data. 

Why is brain tumour data important?

When you have been diagnosed with a brain tumour, we know that understanding the landscape you are in is key to helping you make decisions. You might want to know more about brain tumour survival rates in your area, for your age group, or how people near you were diagnosed. You may also want to know what sort of treatment people like you might be getting. The Brain Tumour Data Dashboard helps you to explore questions like this.

The data you can explore

For launch, the Brain Tumour Data Dashboard includes data on:

  • brain tumour survival
  • chemotherpay
  • radiotherapy
  • routes to diagnosis

The data is being updated regularly, and represents the most up-to-date and complete population level data available, and new fields (like brain tumour surgery) will be added in the future.

It’s your data

When a person is diagnosed with cancer in the UK information about them is automatically included in their national cancer registry. There are registries for England, Wales, Northern Ireland and Scotland.

It is data from cancer registries that tells us how many people are diagnosed with cancer, what treatments they have, how long they live, and whether this is getting better or worse. This information can then be used to help plan cancer services and identify where further progress is needed in order to improve the lives of all people affected by cancer.

Read more about cancer registration here

Clearly, cancer data is important for doctors, researchers and NHS managers. But we believe that as it is your data, you too should be able to access it in a meaningful way. This matter of principle is a key reason why we have been working hard at brainstrust for you to have access to this data.  This is why we have been heavily committed to projects like the Patient Information Portal, and this Brain Tumour Data Dashboard.

Working in partnership for meaningful, safe and secure brain tumour data

Your data should only be collected if it is going to be useful, and also used. Your data should only be used to improve treatment, care and ultimately survival.

We are working at a national level, with NCRAS who have a track record of producing meaningful population level data that drives change for people with cancer rather than starting a new registry (or data bank). We  know that to be meaningful (or useful) data has to be population based, and it must be as complete as possible. Incomplete data does not paint an accurate picture and is therefore misleading. For us to understand brain tumours, we must look at population level data.

The cancer registry aims to include information on all cancer patients. This is because the more complete the cancer registries are, the more useful they are.

The completeness of the registry is most important when trying to understand things that only affect a small number of people of people. For example:

  • Rarer and less common cancers (brain tumours are classified as a ‘less common’ cancer)
  • A potential cause of cancer in a small group e.g. children who live near a power line

Safety is also an important consideration when sharing data, and we know that cancer registries take great care to keep the information they hold about you confidential with strict ethical safeguards in place and access is strictly controlled. To make this data available to you via the brain tumour data dashboard, the NCRAS has developed stringent criteria and strict process that must be adhered to in order to ensure that data remains completely anonymous. This has been a key part of the ‘Get Data Out’ project, which you can read about here.

What you will see in the Brain Tumour Data Dashboard

The information you see represents the most up-to-date, official, population level brain tumour data available for England and Wales. Over time we will be adding to the brain tumour data available and publishing reports, with recommendations, as a result of what we learn from this data.

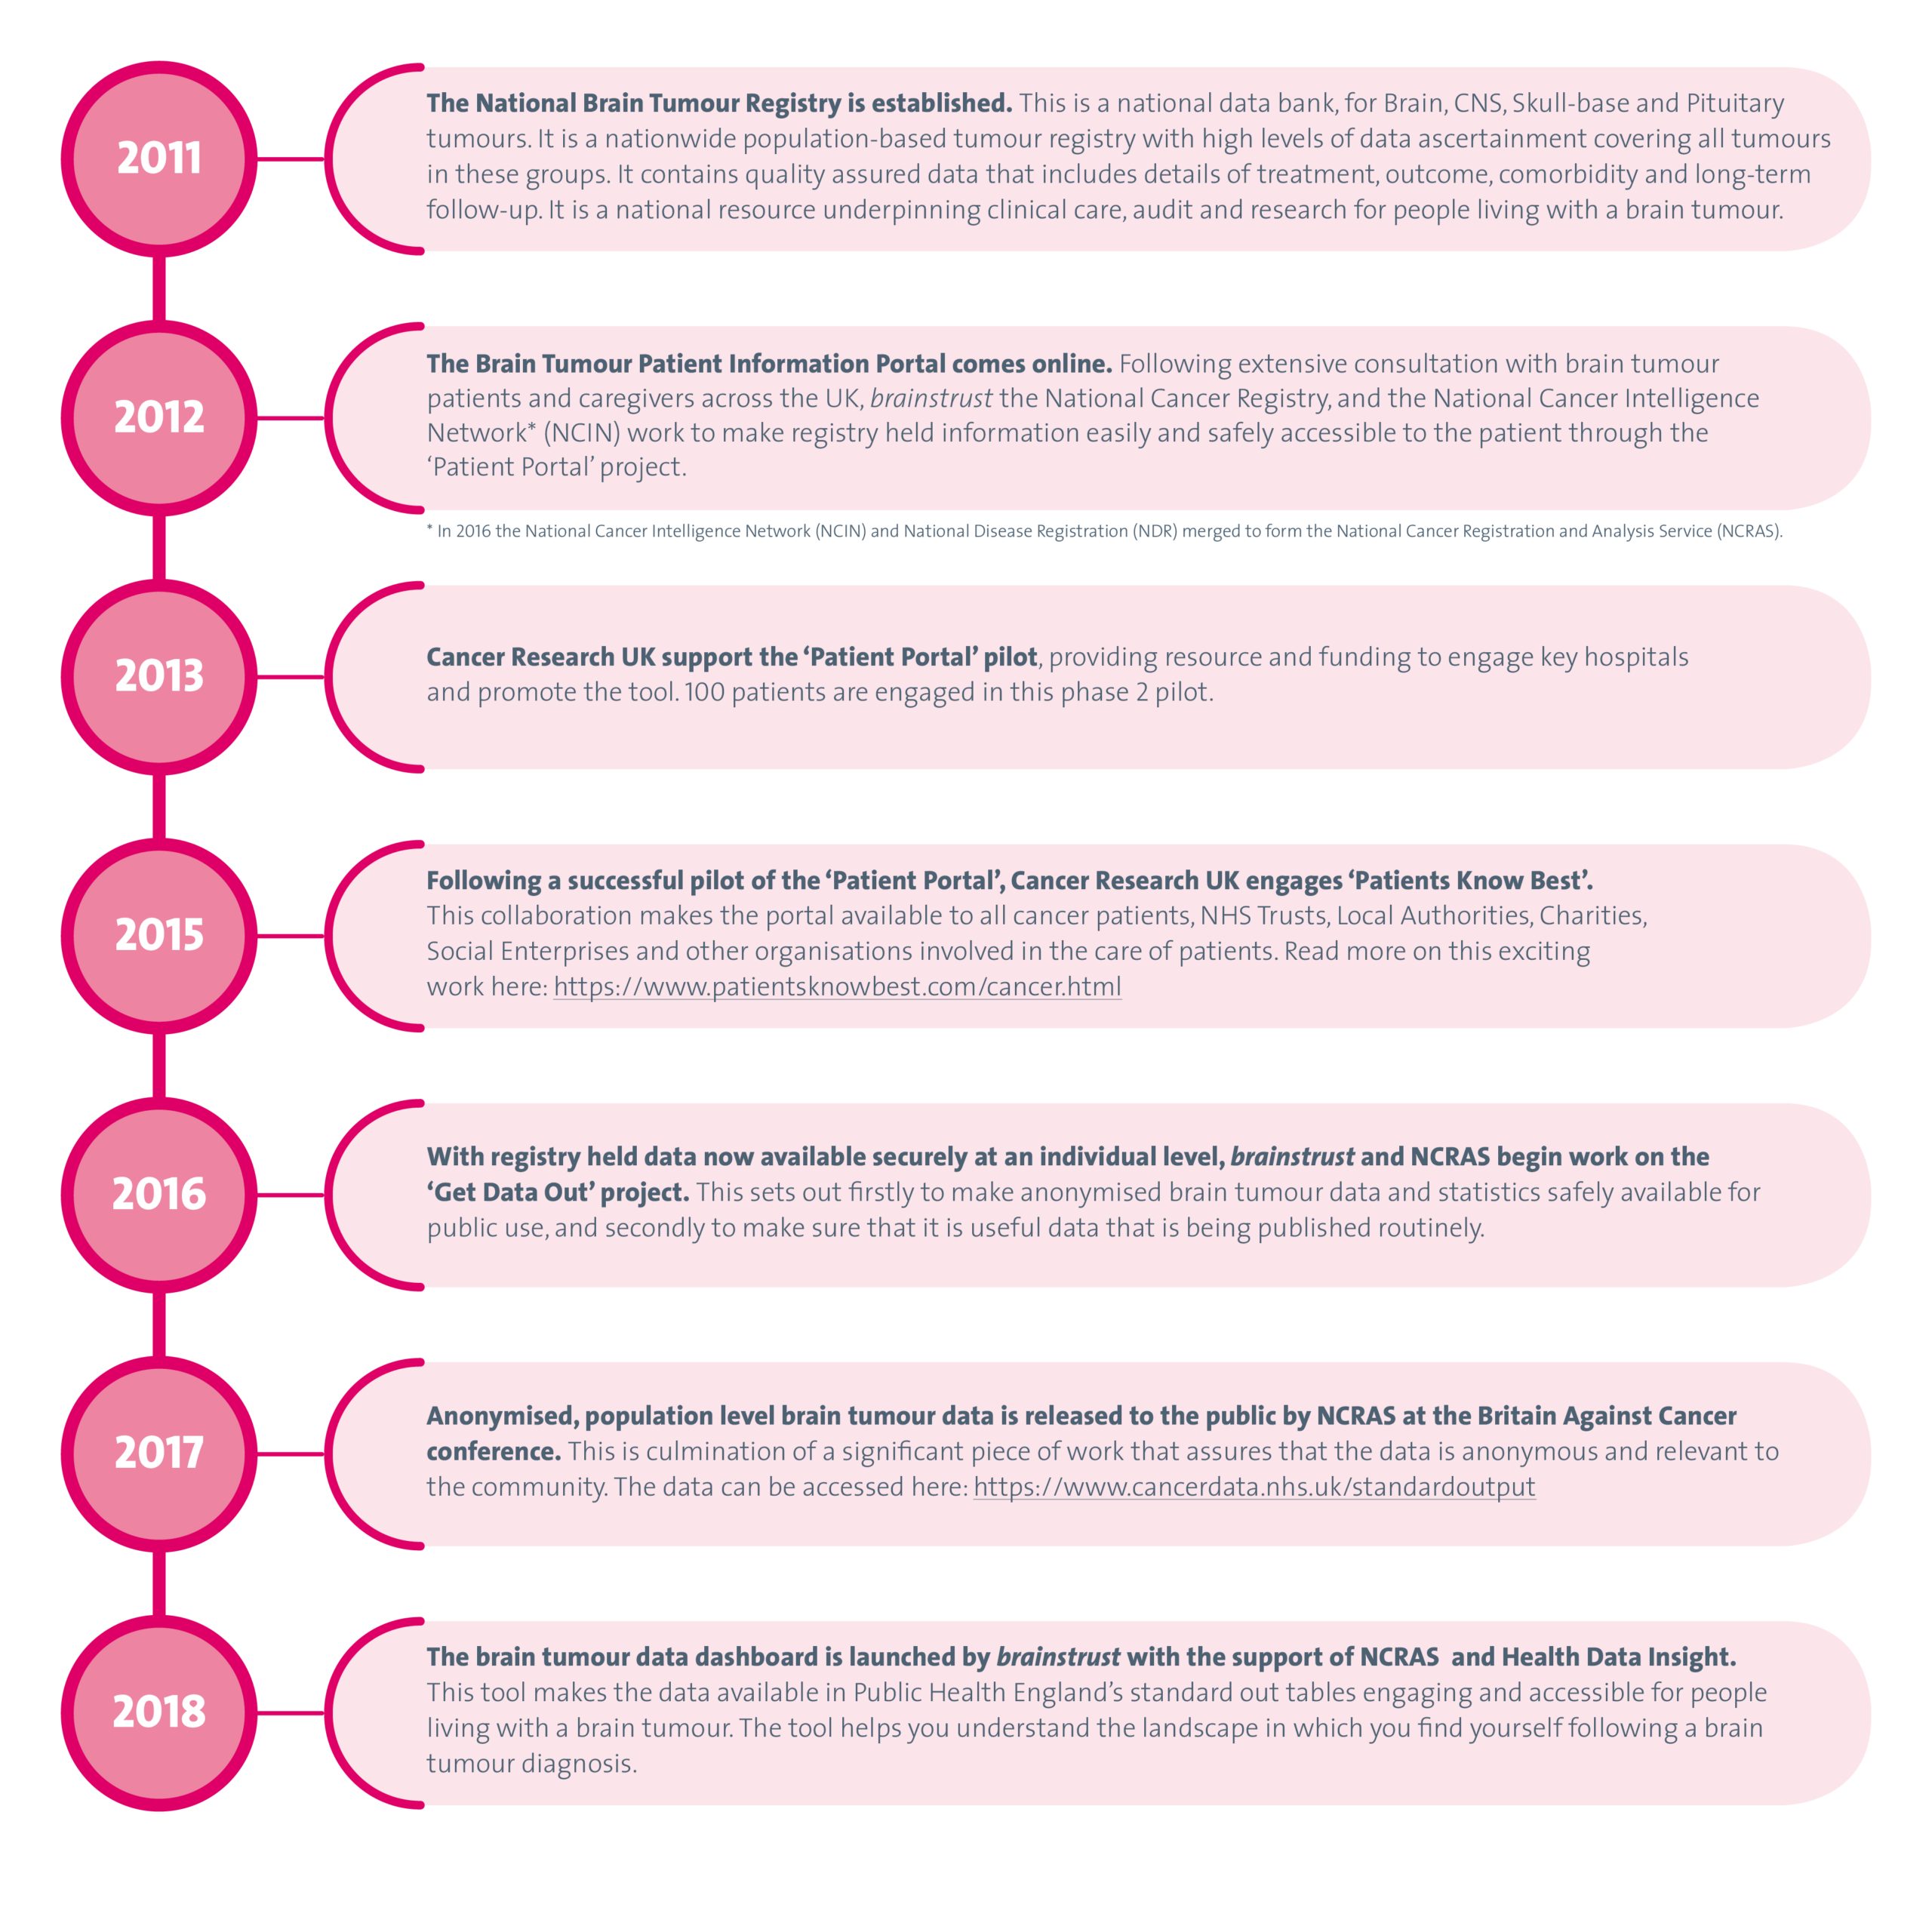
The brain tumour data timeline

brain tumour data timeline

the three tumoursistock 155248927

Introduction

The Brain Tumour Data Dashboard lets you explore up -to-date, population level data about the brain tumours diagnosed in England between 2013 and 2015. Using the drop down menus on the left you can select different groups of patients to view in the charts below. In these charts the number of patients for every 100 diagnoses is displayed as images of people. Patients have been grouped by date of diagnosis, type of tumour, age, gender, and region in England.

For each group of patients you can explore the different routes to diagnosis, the proportion of those who received chemotherapy or radiotherapy, as well as the survival of the patients within each group. For more information about what these metrics mean please see the glossary.

How to use

  1. Select the year of diagnosis using the drop down menu.
  2. Select your patient group of interest from the four drop down menus in the following order:
    1. Tumour group
    2. Age at diagnosis
    3. Region of England
    4. Gender of patient
  3. To view a second chart to compare different groups of patients, click the ‘compare’ button.The second chart will appear below the first chart.

*Note that the tool is best used on a laptop or tablet rather than a mobile phone*

Unavailable data

Some of the data in these charts is not available.There are two main reasons for this:

  1. How the data has been grouped

If you cannot select a patient group from the drop down menus, the data is unavailable because of how the data has been organised.

Public Health England has grouped the data like a branching tree. The bottom of the tree contains all the patients with brain tumours, and then each branch divides the data by a certain characteristics, like age, or location of tumour. But the data is divided in an order, starting with location of the tumour (endocrine or brain), then by age, region, and gender. Age is at the start because it makes a bigger difference to survival rates and treatment rates than gender or region. Sometimes, after the data has been split by type of tumour and age, there is not enough data to be split again. This is because to protect patient confidentiality groups cannot contain less than 100 patients. Because some groups cannot be split further, you cannot create ‘totals’ for everyone by region or gender. For example, you cannot see results for all ages by region, or all brain tumours by gender. If these totals were calculated and released, it might be possible to identify patients, which is why Public Health England cannot release this data.

  1. Statistical reasons and data availability

If you can select a patient group from the chart menus, but the chart does not display, the data is unavailable for one of several reasons:

  1. Data is not yet available for the selected year from Public Health England.
  2. Data is not available because the data quality is too poor to release this statistic.
  3. Data is not available as the statistic is not appropriate for this group.
  4. Data is not available because the standard error of the estimate was greater than 20% and so the estimate has been supressed.

Up to date brain tumour data

Brain tumour data may influence the decisions you make about your care. Data also helps you understand the bigger picture, or landscape, in which you find yourself.

Brain tumour data and statistics influence the focus, and work of organisations like brainstrust. The information helps us to understand the scale and impact of the problems we are setting out to solve.

This tool helps you understand the landscape in which you find yourself having been diagnosed with a brain tumour. This landscape can be particularly tricky to navigate as there are many different types of brain tumour, all of which have a different impact.

The information you see represents the most up-to-date, official, population level brain tumour data available for England. Over time we will be adding to the brain tumour data available and publishing reports, with recommendations, as a result of what we learn from this data.

The data behind this content has come from Public Health England’s National Cancer Registration and Analysis Service (NCRAS) and is a direct result of the ‘Get Data Out’ project.

This project provides anonymised population level brain tumour data for public use in the form of standard output tables, accessible here: http://cancerdata.nhs.uk/standardoutput

Incidence

The number or rate (per head of population) of new cases of a disease diagnosed in a given population during a specified time period (usually a calendar year). The crude rate is the total number of cases divided by the mid-year population, usually expressed per 100,000 population.

Malignant

Malignant tumours which grow by invasion into surrounding tissues and have the ability to metastasise to distant sites

Mortality

The number or rate (per head of population) of deaths in a given population during a specified time period (usually a calendar year). The crude rate is the total number of deaths divided by the mid-year population, usually expressed per 100,000 population.

Non-malignant

Not cancerousNon-malignant tumours may grow larger but do not spread to other parts of the body.

Survival

The length of time from the date of diagnosis for a disease, such as cancer, that patients diagnosed with the disease are still alive. In a clinical trial, measuring the survival is one way to see how well a new treatment works. Also called ‘overall survival’ or ‘OS’.

Routes to Diagnosis

Under the ‘Routes to Diagnosis’ tab in the Brain Tumour Data Dashboard, you can explore the ways patients have been diagnosed with brain tumours. There are many ways, or routes, for cancers to be diagnosed in the NHS. A ‘route to diagnosis’ is the series of events between a patient and the healthcare system that leads to a diagnosis of cancer. The routes include:

  1. Two Week Wait

Patients are urgently referred by their GP for suspected cancer via the Two Week Wait system and are seen by a specialist within 2 weeks where they are diagnosed.

  1. GP referral

Diagnosis via a GP referral includes routine and urgent referrals where the patient was not referred under the Two Week Wait system.

  1. Emergency Presentation

Cancers can be diagnosed via emergency situations such as via A&E, emergency GP referral, emergency transfer or emergency admission.

  1. Outpatient

Outpatient cancer diagnoses include diagnoses via an elective route which started with an outpatient appointment that is either a self-referral or consultant to consultant referral. (It does not include those under the Two Week Wait referral system).

  1. Inpatient elective

Diagnosis via an inpatient elective route is where diagnosis occurs after the patient has been admitted into secondary care from a waiting list, or where the admission is booked or planned.

  1. Death Certificate Only

Diagnoses made by Death Certificate Only are made where there is no more information about the cancer diagnosis other than the cancer related death notifications. The date of diagnosis is the same as that of the date of death.

  1. Unknown

For some patients with a cancer diagnosis, there is no relevant data available to understand the route to diagnosis.


More information

If any of the statistical terms in this section of the brainstrust website are hard to understand, we recommend looking them up here:

Cancer Research UK’s Cancer Statistics Explained

http://www.cancerresearchuk.org/health-professional/cancer-statistics/cancer-stats-explained/statistics-terminology-explained#heading-Seven

If you are looking for help understanding terms relating specifically to brain tumours, and treatment, then the brainstrust glossary is available here:

https://www.brainstrust.org.uk/advice-glossary.php