In Fundraising News

Another year, another incredible Legacy Festival

Legacy Festival is an annual three-day event organised by Lyndsey Rowe, founder of Lloyd’s Legacy. As a lasting tribute to her son, Legacy Festival celebrates family and friendship with a focus on live music, outdoor camping, exciting games and good food. It’s an event which people come back to year on year – a firm favourite in the diary, and we know just why! This July, our new Community Fundraiser, Sophie, set off on a journey from Leeds to Eastleigh to lend a helping hand, and to see it all in action. Read Sophie’s story below:

The sun was shining and the stage was set

When I first arrived, I received such a warm welcome. I knew from that moment on that I’d have a fabulous time. After being introduced to Lyndsey and her friends and family, it was clear to see just how much this event meant to everyone. Looking out onto two stages, a row of marquees, a pre-built bar and games area, I could tell how hard everyone had worked in the months and weeks building up to the big weekend. Come rain or shine, this event was going to be a huge success.

All the colours of the rainbow

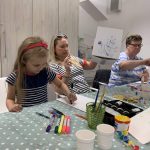
My first task of the day was to proudly display the Lloyd’s Legacy rainbow next to the main stage. With meters of coloured netting and more cable ties than you can imagine, it was time to do some DIY crafting! The finished result didn’t fail to catch the eye, and reminded everyone why this event was so special.

Ice cream, anyone?

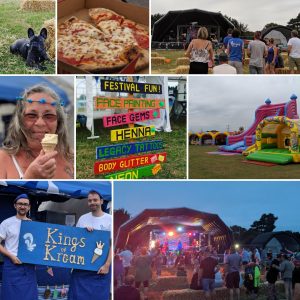
Following the hottest day of the year, it was time to stock up on ice cream! With hundreds of people traveling to Eastleigh for the festival, I had to beat the traffic in search of the most retro ice creams I could find. With Fabs, Nobbly Bobblys and Twisters in the basket, I stocked up on Flakes and headed back to site. When I returned, I was greeted by the troublesome duo running ‘King’s of Kream’, Legacy Festival’s very own ice cream shop.

When the music comes to you

It wasn’t long before the music started and the event got into full swing. It’s safe to say I had a front row seat, and made memories to last a lifetime. The bands didn’t disappoint, playing their unique versions of hit songs that everyone could sing-a-long and dance to, and that they did! My favourite part of the night, by far, was being immersed by musicians as they spontaneously made their way through the crowd mid-performance. The atmosphere made for an incredible experience, with beaming smiles and laughter all-round.

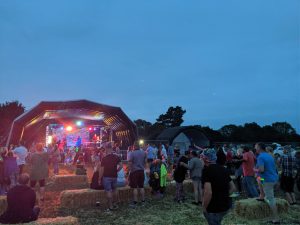
The sun went down and the crowds appeared

With a long journey ahead of me, it was time to head back… but it’s fair to say, I didn’t want to leave! Even though I’d been there all day, it seemed like it had only just begun. The already big crowd seemed to double in size, and they were there to stay (quite literally, with almost everyone camping on-site). I stood with Lyndsey and soaked it all in – one of those mid-chaos moments you look back on and smile. As we watched the fire dancer perform with the live band (yes, a fire dancer), we talked about how special it was to watch the event come to life in all its glory.

A lasting legacy 

This year, Legacy Festival raised an incredible £8,413.39! Lloyd’s Legacy have now raised over £30,000 for brainstrust, and we couldn’t be more grateful. A huge thank you goes out to the event organisers, the many volunteers, supporters, and of course, everyone who attended. The proceeds raised at Legacy Festival will help to fund counselling sessions, a cause which Lloyd himself was very passionate about.
Here at brainstrust, we are incredibly proud to have supported thousands of people through such a difficult journey, and we couldn’t do this without the generosity an support we receive from funds like Lloyd’s Legacy.
img 2788logbook 10 social media

Introduction

The Brain Tumour Data Dashboard lets you explore up -to-date, population level data about the brain tumours diagnosed in England between 2013 and 2015. Using the drop down menus on the left you can select different groups of patients to view in the charts below. In these charts the number of patients for every 100 diagnoses is displayed as images of people. Patients have been grouped by date of diagnosis, type of tumour, age, gender, and region in England.

For each group of patients you can explore the different routes to diagnosis, the proportion of those who received chemotherapy or radiotherapy, as well as the survival of the patients within each group. For more information about what these metrics mean please see the glossary.

How to use

  1. Select the year of diagnosis using the drop down menu.
  2. Select your patient group of interest from the four drop down menus in the following order:
    1. Tumour group
    2. Age at diagnosis
    3. Region of England
    4. Gender of patient
  3. To view a second chart to compare different groups of patients, click the ‘compare’ button.The second chart will appear below the first chart.

*Note that the tool is best used on a laptop or tablet rather than a mobile phone*

Unavailable data

Some of the data in these charts is not available.There are two main reasons for this:

  1. How the data has been grouped

If you cannot select a patient group from the drop down menus, the data is unavailable because of how the data has been organised.

Public Health England has grouped the data like a branching tree. The bottom of the tree contains all the patients with brain tumours, and then each branch divides the data by a certain characteristics, like age, or location of tumour. But the data is divided in an order, starting with location of the tumour (endocrine or brain), then by age, region, and gender. Age is at the start because it makes a bigger difference to survival rates and treatment rates than gender or region. Sometimes, after the data has been split by type of tumour and age, there is not enough data to be split again. This is because to protect patient confidentiality groups cannot contain less than 100 patients. Because some groups cannot be split further, you cannot create ‘totals’ for everyone by region or gender. For example, you cannot see results for all ages by region, or all brain tumours by gender. If these totals were calculated and released, it might be possible to identify patients, which is why Public Health England cannot release this data.

  1. Statistical reasons and data availability

If you can select a patient group from the chart menus, but the chart does not display, the data is unavailable for one of several reasons:

  1. Data is not yet available for the selected year from Public Health England.
  2. Data is not available because the data quality is too poor to release this statistic.
  3. Data is not available as the statistic is not appropriate for this group.
  4. Data is not available because the standard error of the estimate was greater than 20% and so the estimate has been supressed.

Up to date brain tumour data

Brain tumour data may influence the decisions you make about your care. Data also helps you understand the bigger picture, or landscape, in which you find yourself.

Brain tumour data and statistics influence the focus, and work of organisations like brainstrust. The information helps us to understand the scale and impact of the problems we are setting out to solve.

This tool helps you understand the landscape in which you find yourself having been diagnosed with a brain tumour. This landscape can be particularly tricky to navigate as there are many different types of brain tumour, all of which have a different impact.

The information you see represents the most up-to-date, official, population level brain tumour data available for England. Over time we will be adding to the brain tumour data available and publishing reports, with recommendations, as a result of what we learn from this data.

The data behind this content has come from Public Health England’s National Cancer Registration and Analysis Service (NCRAS) and is a direct result of the ‘Get Data Out’ project.

This project provides anonymised population level brain tumour data for public use in the form of standard output tables, accessible here: http://cancerdata.nhs.uk/standardoutput

Incidence

The number or rate (per head of population) of new cases of a disease diagnosed in a given population during a specified time period (usually a calendar year). The crude rate is the total number of cases divided by the mid-year population, usually expressed per 100,000 population.

Malignant

Malignant tumours which grow by invasion into surrounding tissues and have the ability to metastasise to distant sites

Mortality

The number or rate (per head of population) of deaths in a given population during a specified time period (usually a calendar year). The crude rate is the total number of deaths divided by the mid-year population, usually expressed per 100,000 population.

Non-malignant

Not cancerousNon-malignant tumours may grow larger but do not spread to other parts of the body.

Survival

The length of time from the date of diagnosis for a disease, such as cancer, that patients diagnosed with the disease are still alive. In a clinical trial, measuring the survival is one way to see how well a new treatment works. Also called ‘overall survival’ or ‘OS’.

Routes to Diagnosis

Under the ‘Routes to Diagnosis’ tab in the Brain Tumour Data Dashboard, you can explore the ways patients have been diagnosed with brain tumours. There are many ways, or routes, for cancers to be diagnosed in the NHS. A ‘route to diagnosis’ is the series of events between a patient and the healthcare system that leads to a diagnosis of cancer. The routes include:

  1. Two Week Wait

Patients are urgently referred by their GP for suspected cancer via the Two Week Wait system and are seen by a specialist within 2 weeks where they are diagnosed.

  1. GP referral

Diagnosis via a GP referral includes routine and urgent referrals where the patient was not referred under the Two Week Wait system.

  1. Emergency Presentation

Cancers can be diagnosed via emergency situations such as via A&E, emergency GP referral, emergency transfer or emergency admission.

  1. Outpatient

Outpatient cancer diagnoses include diagnoses via an elective route which started with an outpatient appointment that is either a self-referral or consultant to consultant referral. (It does not include those under the Two Week Wait referral system).

  1. Inpatient elective

Diagnosis via an inpatient elective route is where diagnosis occurs after the patient has been admitted into secondary care from a waiting list, or where the admission is booked or planned.

  1. Death Certificate Only

Diagnoses made by Death Certificate Only are made where there is no more information about the cancer diagnosis other than the cancer related death notifications. The date of diagnosis is the same as that of the date of death.

  1. Unknown

For some patients with a cancer diagnosis, there is no relevant data available to understand the route to diagnosis.


More information

If any of the statistical terms in this section of the brainstrust website are hard to understand, we recommend looking them up here:

Cancer Research UK’s Cancer Statistics Explained

http://www.cancerresearchuk.org/health-professional/cancer-statistics/cancer-stats-explained/statistics-terminology-explained#heading-Seven

If you are looking for help understanding terms relating specifically to brain tumours, and treatment, then the brainstrust glossary is available here:

https://www.brainstrust.org.uk/advice-glossary.php