In Brain News

Here long time brainstrust supporter and ambassador Barty Hills shares a frank and stunning insight into the challenges that come following treatment for a brain tumour.

So much of what Barty has to say resonates with what we’re hearing from hundreds of others. There’s a massive gap between this dogged determination to improve clinical care and the quest for a cure, it’s so frustrating. Even more so for those who are “cured”. There’s so much to rationalise: ‘why me?’, ‘why now?’, ‘where do I pick up?’, ‘what does the future look like?’, ‘why do people keep saying I’m lucky?’.

For Barty to share this reality so boldly is vital in helping others understand what life with a brain tumour, and the new normal it brings, is like.

Post brain-tumour update, 13 March 2019:

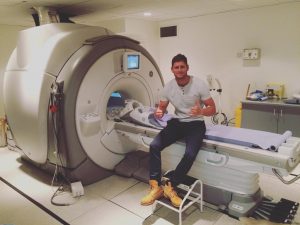
“It’s taken me a bit of time to realize that having 2 brain tumour surgeries was actually pretty easy. Not trying to sound like a tough guy, I mean you’re on so many drugs you can’t feel anything anyway, but keep reading…

(I just want to say that this is my experience with my brain tumour, which apparently was a good one to have, and not to take anything from those who have much harder battles to fight).

I used the word easy in the context with and comparison to the mental challenges we can all face for a million different reasons. My mental struggle could have come as a repercussion from the surgery or any number of reasons but the reason is not important.

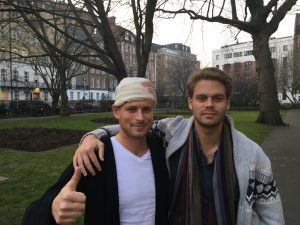
Surgery was easy because I had fantastic support from my family and friends. I was made to feel like a war hero when all I was doing was surrendering myself to the impressive capabilities of neurosurgeons, whilst being put to sleep for a few hours. I may be downplaying it a bit, there is some acceptance that you have to come to terms with, but generally I was happy getting so much attention for a nap.

The aftermath

But it is really the aftermath, the normal life without support – and expectancy to crack on and live a normal/successful life – that’s the difficult part. Expectancy is a dangerous thing. I became used to being taken care of and everyone always asking how I was and telling I was doing very well etc.

Don’t get me wrong – this is amazing and has shown me the greatest side to people. I’m saying it was easy enough to live under the identity of a brain tumour survivor, and nothing more. We are all so much more than the little identities we box ourselves in. Honestly, being brain tumour free “normal” has been the hardest battle I’ve had to fight.

You’re alone and trying to figure things out by yourself and it’s a crazy ever changing monstrous world out there that doesn’t care about you. You have to care about you and figure out how to live and be happy by yourself.

But now 3 years after my last surgery and still brain tumour free I feel like I am getting better. Not because of my physical health, job or anything else, but because I am finally accepting myself as I am and choosing to prioritise my mental well-being and work on me, for me.

Learning to enjoy the ride

It’s very tough and I will always be a work in progress with ups and downs, highs and lows. Destination in sight but no finish line, just learn to enjoy the ride. I am just getting started, feeling a bit like Bambi on skates, but happy to be here where I am now and knowing that I’m going to give it everything I’ve got to become the best version of Barty!

Thank you to everyone who’s been part of my journey so far, I really appreciate all of you.

Shout out to everyone going through their mental battles everyday. Keep working on you and focus on what makes you happy! Accept and appreciate who you are now and be excited for where you are going!

And for any brain tumour sufferers out there, I’m always here if you wanna chat.”

You can follow Barty on Twitter @BartyHills

This Brain Tumour Awareness Month – share your story. Drop an email to eve@brainstrust.org.uk if you’d like to share your story, to help other people understand the impact of a brain tumour diagnosis.

prl surrey 100 2019 with backgroundcharity donation

Introduction

The Brain Tumour Data Dashboard lets you explore up -to-date, population level data about the brain tumours diagnosed in England between 2013 and 2015. Using the drop down menus on the left you can select different groups of patients to view in the charts below. In these charts the number of patients for every 100 diagnoses is displayed as images of people. Patients have been grouped by date of diagnosis, type of tumour, age, gender, and region in England.

For each group of patients you can explore the different routes to diagnosis, the proportion of those who received chemotherapy or radiotherapy, as well as the survival of the patients within each group. For more information about what these metrics mean please see the glossary.

How to use

  1. Select the year of diagnosis using the drop down menu.
  2. Select your patient group of interest from the four drop down menus in the following order:
    1. Tumour group
    2. Age at diagnosis
    3. Region of England
    4. Gender of patient
  3. To view a second chart to compare different groups of patients, click the ‘compare’ button.The second chart will appear below the first chart.

*Note that the tool is best used on a laptop or tablet rather than a mobile phone*

Unavailable data

Some of the data in these charts is not available.There are two main reasons for this:

  1. How the data has been grouped

If you cannot select a patient group from the drop down menus, the data is unavailable because of how the data has been organised.

Public Health England has grouped the data like a branching tree. The bottom of the tree contains all the patients with brain tumours, and then each branch divides the data by a certain characteristics, like age, or location of tumour. But the data is divided in an order, starting with location of the tumour (endocrine or brain), then by age, region, and gender. Age is at the start because it makes a bigger difference to survival rates and treatment rates than gender or region. Sometimes, after the data has been split by type of tumour and age, there is not enough data to be split again. This is because to protect patient confidentiality groups cannot contain less than 100 patients. Because some groups cannot be split further, you cannot create ‘totals’ for everyone by region or gender. For example, you cannot see results for all ages by region, or all brain tumours by gender. If these totals were calculated and released, it might be possible to identify patients, which is why Public Health England cannot release this data.

  1. Statistical reasons and data availability

If you can select a patient group from the chart menus, but the chart does not display, the data is unavailable for one of several reasons:

  1. Data is not yet available for the selected year from Public Health England.
  2. Data is not available because the data quality is too poor to release this statistic.
  3. Data is not available as the statistic is not appropriate for this group.
  4. Data is not available because the standard error of the estimate was greater than 20% and so the estimate has been supressed.

Up to date brain tumour data

Brain tumour data may influence the decisions you make about your care. Data also helps you understand the bigger picture, or landscape, in which you find yourself.

Brain tumour data and statistics influence the focus, and work of organisations like brainstrust. The information helps us to understand the scale and impact of the problems we are setting out to solve.

This tool helps you understand the landscape in which you find yourself having been diagnosed with a brain tumour. This landscape can be particularly tricky to navigate as there are many different types of brain tumour, all of which have a different impact.

The information you see represents the most up-to-date, official, population level brain tumour data available for England. Over time we will be adding to the brain tumour data available and publishing reports, with recommendations, as a result of what we learn from this data.

The data behind this content has come from Public Health England’s National Cancer Registration and Analysis Service (NCRAS) and is a direct result of the ‘Get Data Out’ project.

This project provides anonymised population level brain tumour data for public use in the form of standard output tables, accessible here: http://cancerdata.nhs.uk/standardoutput

Incidence

The number or rate (per head of population) of new cases of a disease diagnosed in a given population during a specified time period (usually a calendar year). The crude rate is the total number of cases divided by the mid-year population, usually expressed per 100,000 population.

Malignant

Malignant tumours which grow by invasion into surrounding tissues and have the ability to metastasise to distant sites

Mortality

The number or rate (per head of population) of deaths in a given population during a specified time period (usually a calendar year). The crude rate is the total number of deaths divided by the mid-year population, usually expressed per 100,000 population.

Non-malignant

Not cancerousNon-malignant tumours may grow larger but do not spread to other parts of the body.

Survival

The length of time from the date of diagnosis for a disease, such as cancer, that patients diagnosed with the disease are still alive. In a clinical trial, measuring the survival is one way to see how well a new treatment works. Also called ‘overall survival’ or ‘OS’.

Routes to Diagnosis

Under the ‘Routes to Diagnosis’ tab in the Brain Tumour Data Dashboard, you can explore the ways patients have been diagnosed with brain tumours. There are many ways, or routes, for cancers to be diagnosed in the NHS. A ‘route to diagnosis’ is the series of events between a patient and the healthcare system that leads to a diagnosis of cancer. The routes include:

  1. Two Week Wait

Patients are urgently referred by their GP for suspected cancer via the Two Week Wait system and are seen by a specialist within 2 weeks where they are diagnosed.

  1. GP referral

Diagnosis via a GP referral includes routine and urgent referrals where the patient was not referred under the Two Week Wait system.

  1. Emergency Presentation

Cancers can be diagnosed via emergency situations such as via A&E, emergency GP referral, emergency transfer or emergency admission.

  1. Outpatient

Outpatient cancer diagnoses include diagnoses via an elective route which started with an outpatient appointment that is either a self-referral or consultant to consultant referral. (It does not include those under the Two Week Wait referral system).

  1. Inpatient elective

Diagnosis via an inpatient elective route is where diagnosis occurs after the patient has been admitted into secondary care from a waiting list, or where the admission is booked or planned.

  1. Death Certificate Only

Diagnoses made by Death Certificate Only are made where there is no more information about the cancer diagnosis other than the cancer related death notifications. The date of diagnosis is the same as that of the date of death.

  1. Unknown

For some patients with a cancer diagnosis, there is no relevant data available to understand the route to diagnosis.


More information

If any of the statistical terms in this section of the brainstrust website are hard to understand, we recommend looking them up here:

Cancer Research UK’s Cancer Statistics Explained

http://www.cancerresearchuk.org/health-professional/cancer-statistics/cancer-stats-explained/statistics-terminology-explained#heading-Seven

If you are looking for help understanding terms relating specifically to brain tumours, and treatment, then the brainstrust glossary is available here:

https://www.brainstrust.org.uk/advice-glossary.php