In Fundraising News

In August this year Anthony will be running 500 miles over 10 days from Ben Nevis, to Scafell, to Snowdon. Anthony is taking on the challenge in memory of Seth Dickenson, who sadly lost his life to a brain tumour at the age of seven, and Debbie Austin, Anthony’s lifelong friend and running partner and the original mastermind behind this challenge. 

In this article, we catch up with Anthony ahead of the challenge to find out more about Seth and Debbie and what it’s taken to prepare for the challenge. 

You can donate to Anthony’s challenge via his JustGiving page.

Running for Seth and Debs

My lifelong friend and running partner, Debbie

My inspiration for taking on this challenge is Seth Dickenson and my late running partner Debbie Austin  – who I’ve known since we were 5.

The original inspiration behind the challenge is little Seth Dickenson. In December 2017 Seth was diagnosed with a brain tumour. After surgery and treatment, he was given the all clear in October 2018. Then in February 2020 the devastating news came that his cancer had returned, and this time it was fatal. Despite many dips and subsequent rallies Seth very sadly passed away in May 2021. After learning what a warrior Seth was, and how amazing the Dickenson clan is, I’m honoured to support the family and charities involved. In Debs’s words the Dickensons “know how to squeeze every last drop out of life“.

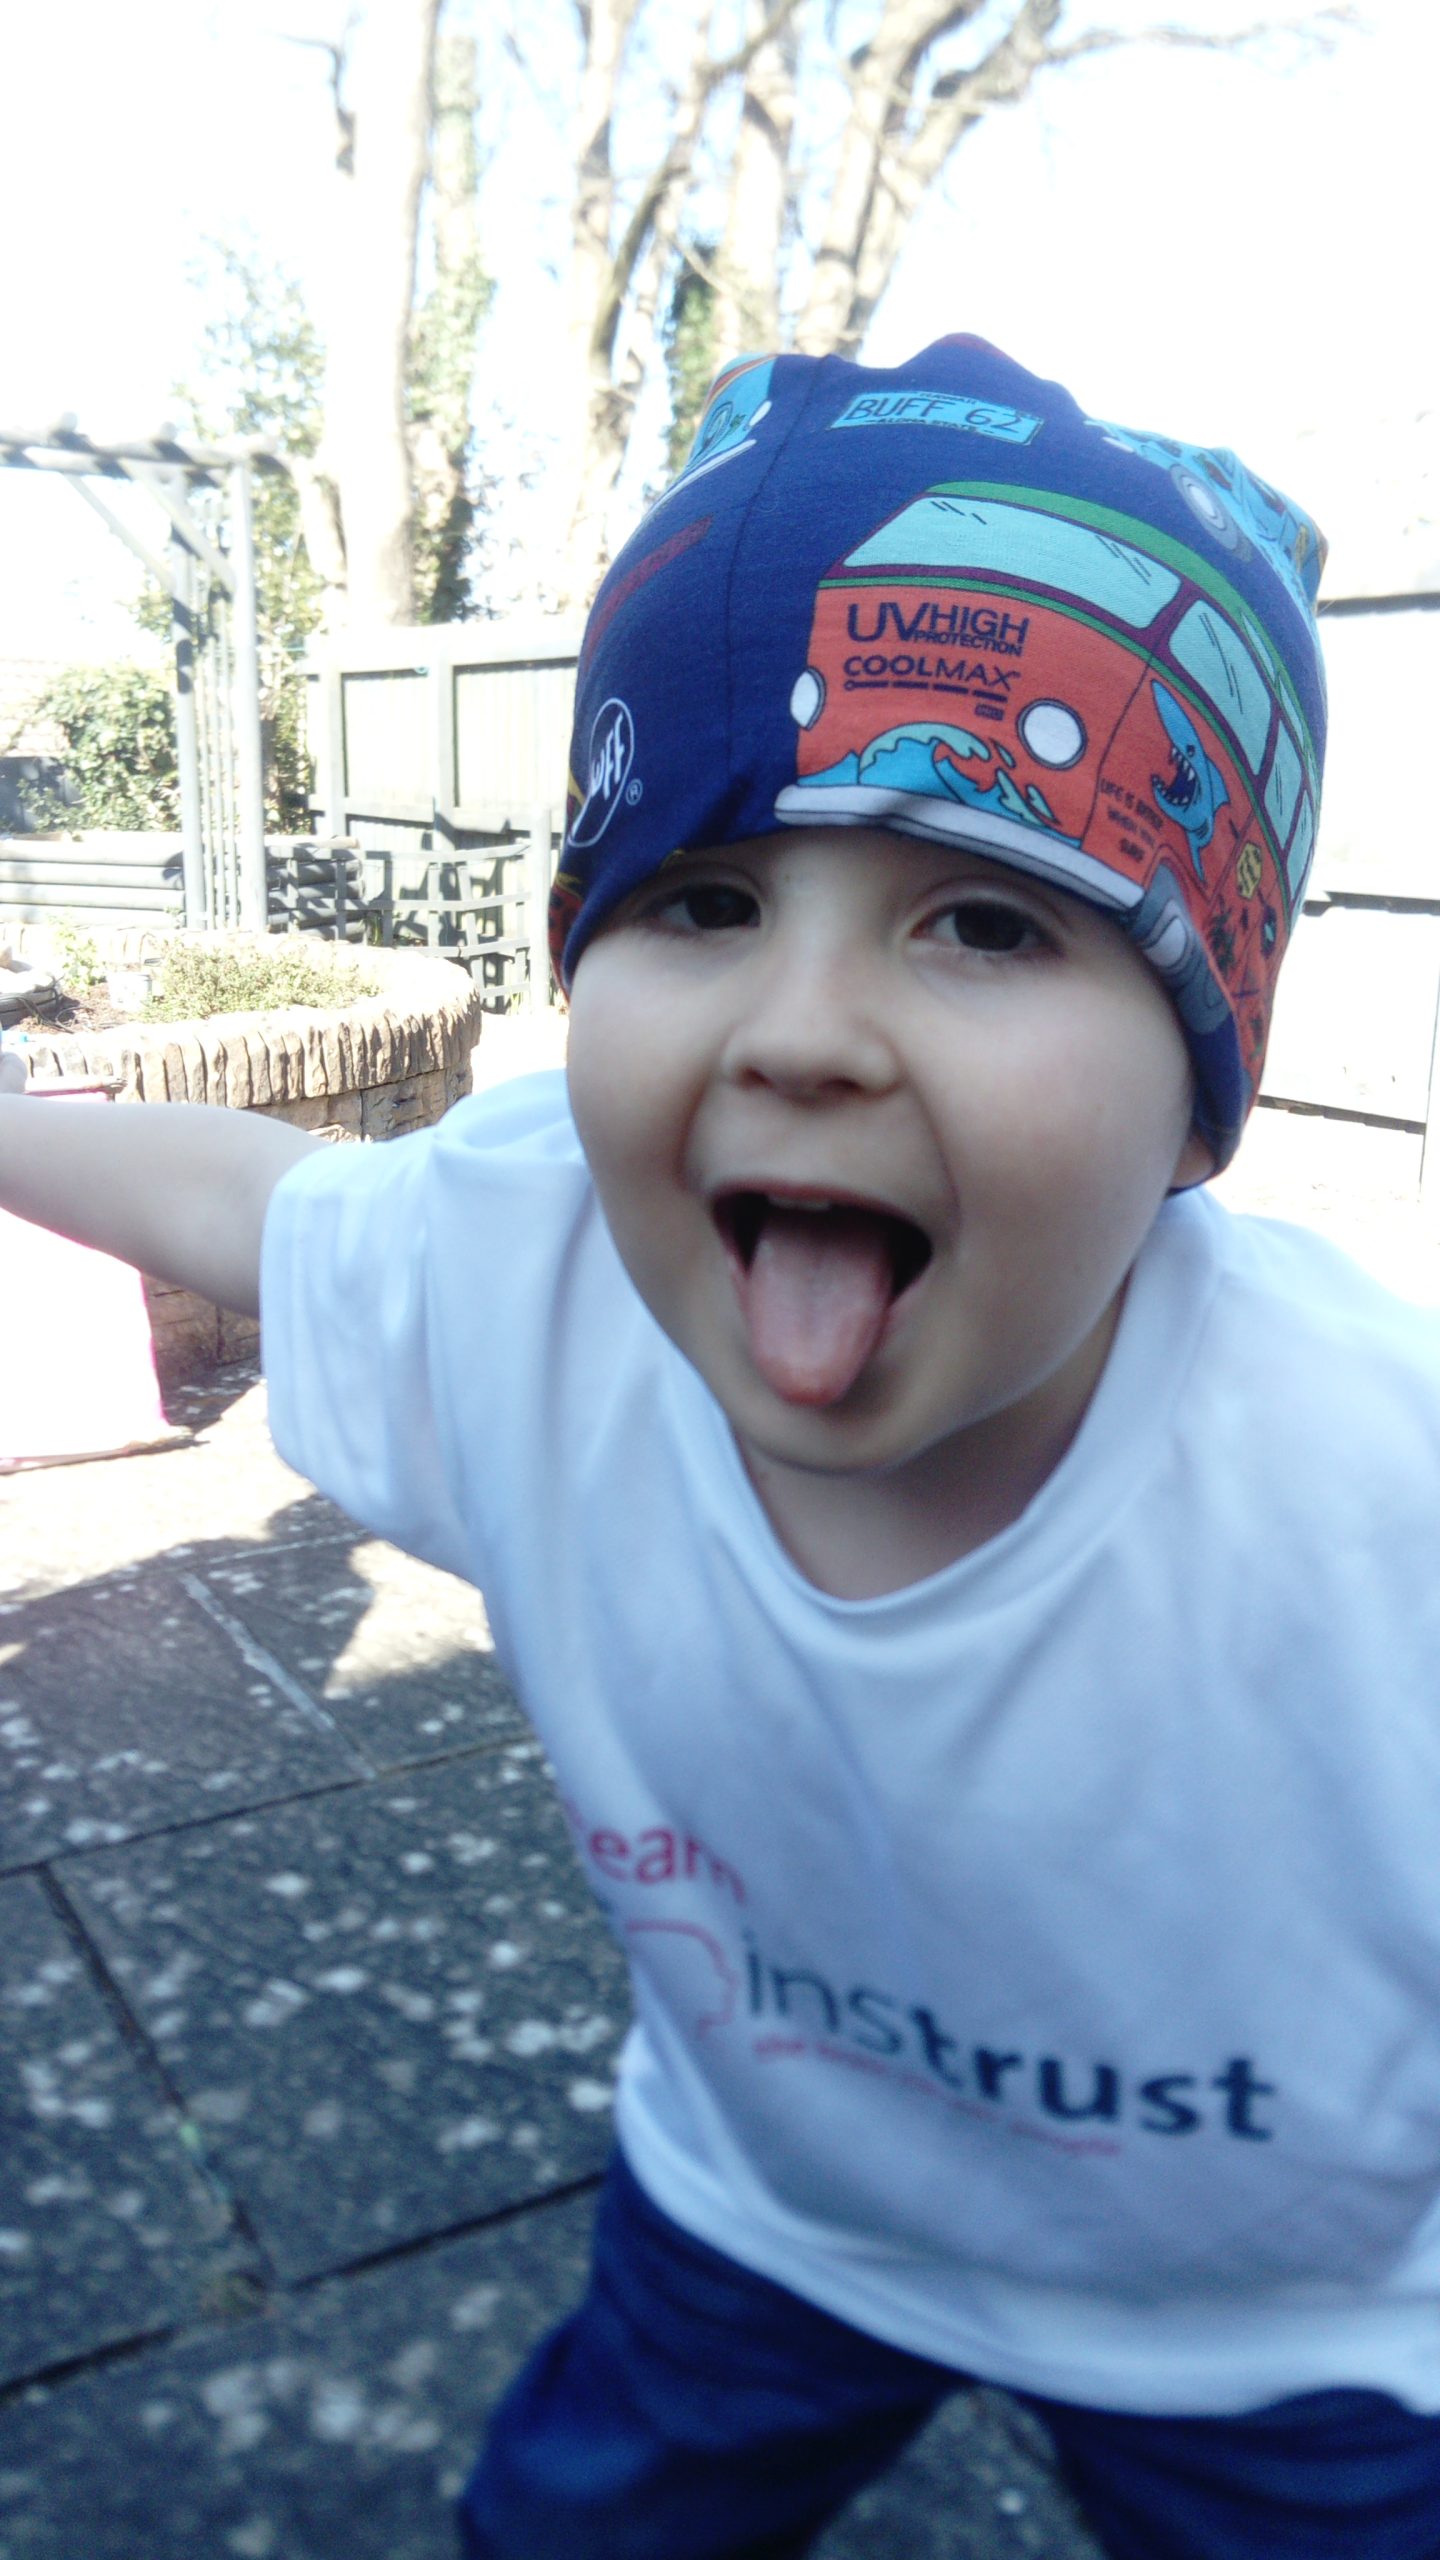
The inspiration behind the challenge: little Seth Dickenson

So, Debs and I agreed to  raise money for the two charities that had done so much for Seth and his family: brainstrust, who support individuals and families dealing with brain cancer, and Little Harbour hospice, where Seth spent many happy months during his hardest times.

After getting a few ultra marathons under our belts, Debbie and I had been discussing what our next challenge would be. I knew Debbie had something crazy planned. She never sat still, she was always pushing her limits. She skipped marathon distance and dived straight into 70-mile ultras, then skipped 100 milers, going straight to 250 milers. But even 250 miles that wasn’t enough for Debs. She wanted to take on 500 miles. Her goal was a supported 10 day race from Ben Nevis in Scotland, passing over Scafell in the Lakes and down into Wales to climb Snowdon.

I had my reservations, but she rarely took no for an answer, so I obliged! I’d wanted to do something on this scale for quite some time – so we inspired each other and committed to the challenge.

Sadly, Debbie passed away before we were able to take on the challenge so I am now running for Seth and in memory of my dear friend Debs too.


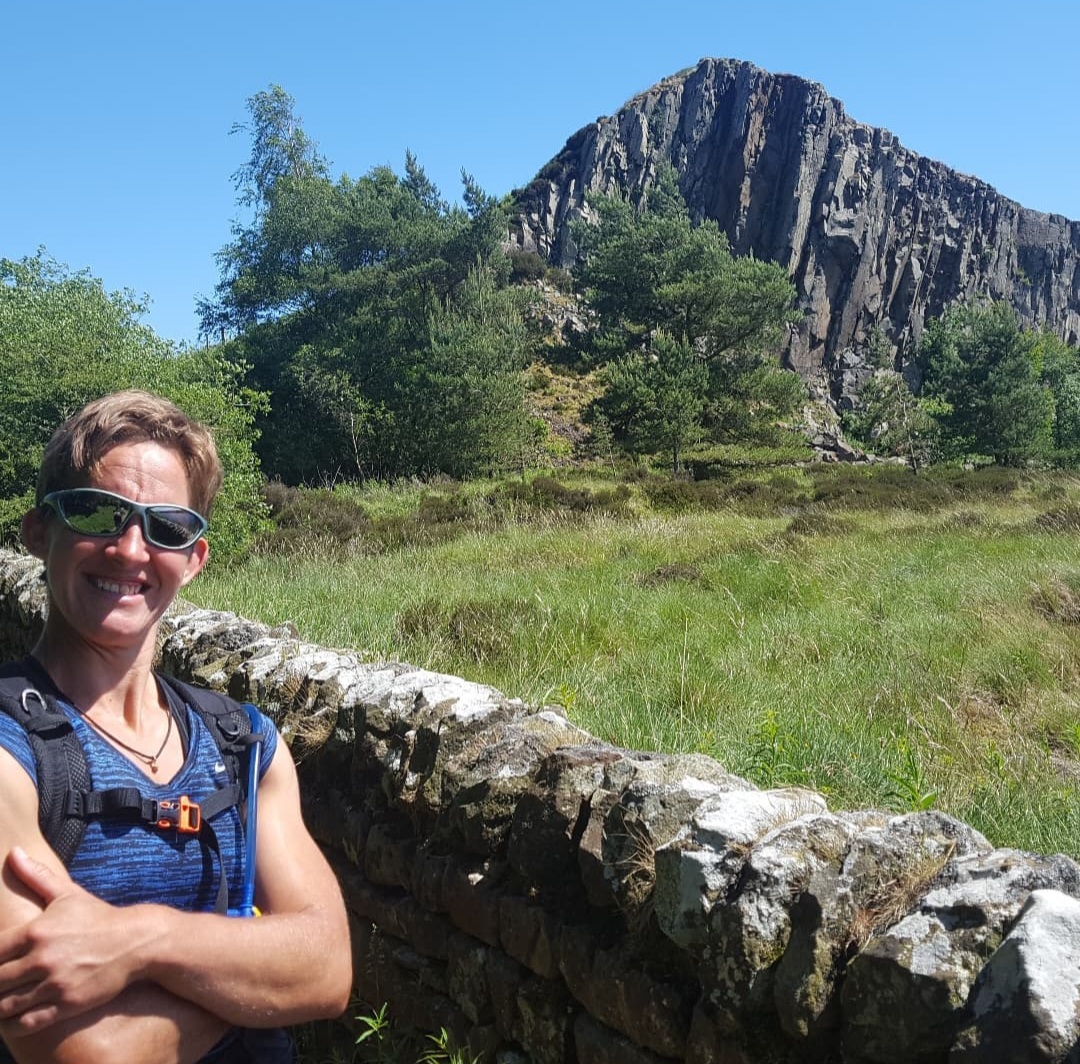
Training for the challenge

The passing of Debs was such a shock. I took a 2-month break from training. I wasn’t sure if I could do this on my own or not. But at her funeral I decided that it wasn’t over. At that point I didn’t know what shape or form the fundraising would take, but I don’t give up easily, I knew I would continue the work we started.

I think of Debs often on my runs, and I can hear her voice in my head keeping me going. I remember her little voice notes she sent to me on the ultras I did without her. The thoughts of all of this keep me going.

Keeping motivated over the last year and a half though has been the toughest, I’ve been balancing a stressful and responsible job, whilst fitting training in between family time and buying a new house. I don’t do things by halves!

The planned 500 mile route

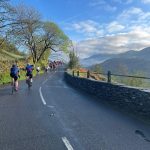
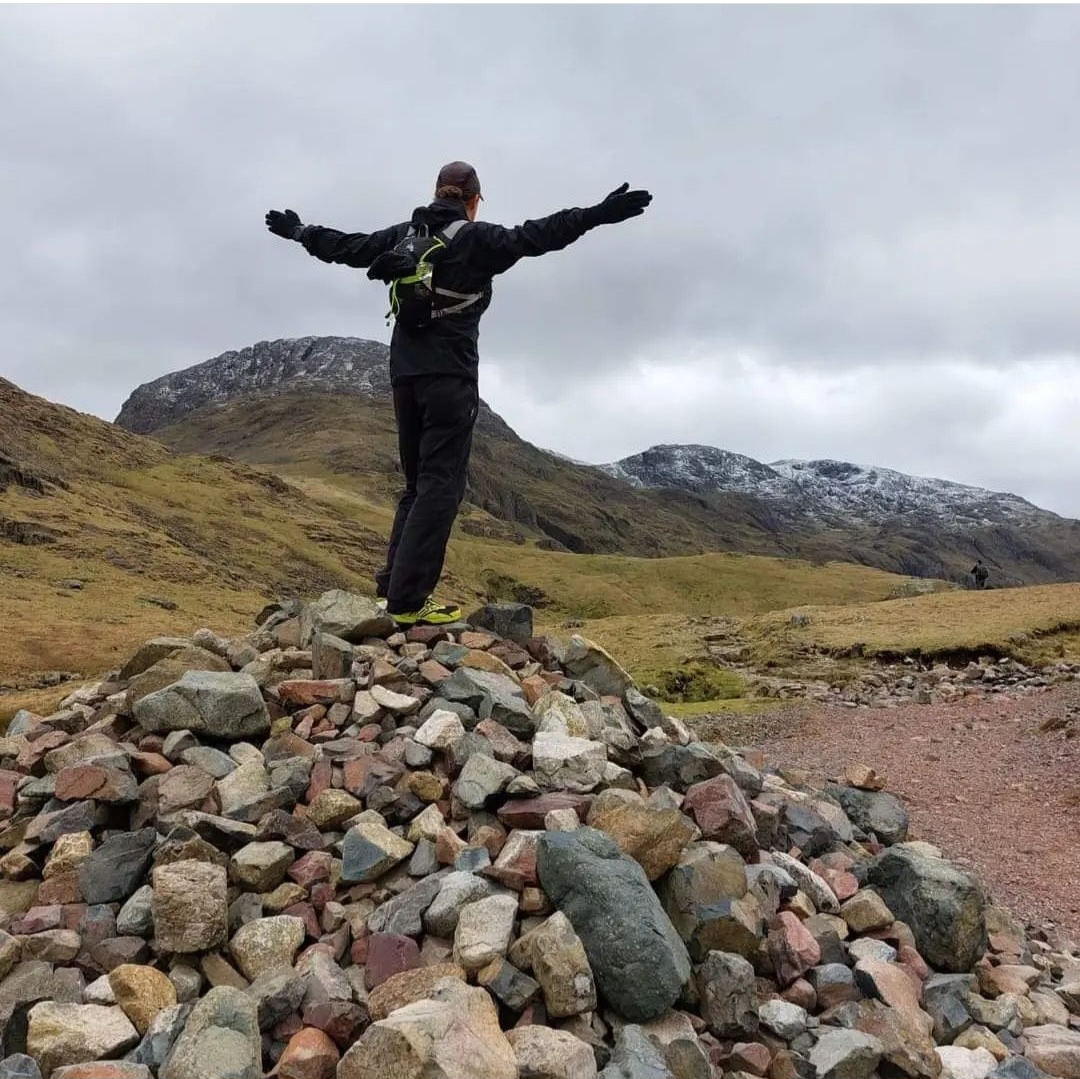
I’ve been put through my paces. I’ve run after long eventful days at work; through the wind, rain and cold; on dark nights in the snow, slipping on the ice. It’s taken, time, money and tears. I’ve weathered constant aches, tiredness and blisters and struggled to balance family life with training demands. But when I’m feeling sorry for myself, my thoughts inevitably go to why I’m doing this, and who for, and this keeps me going.

I’m committed now, I don’t really know what it’s like not to train, my body is used to it now. I’m weirdly going to miss it!

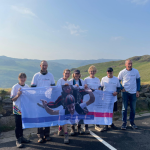
I’ve thought about the challenge every day for the last year and a half. Most morning I wake up with anxiety; wondering if I can do it or not. But I don’t like letting people down, so I persevere. The support of my friends, family, support teams and #teamseth have helped keep me motivated. Hell, I think Rock Choir may have organised something for me on one of the days – I can’t not do it now!


In the last year, I’ve ran 1790 miles, hiked 155 miles, cycled 257 miles. During the 500 mile run I’ll be missing siblings and niece’s birthdays, my daughter’s first day at school and my wedding anniversary. Those sacrifices are nothing compared to what Seth and his family went through and what others with similar diagnosis go through. I’ve got this far, just a little further!


Everyone at brainstrust stands in awe of Anthony and the passion and determination he has put into preparing for this challenge. We will be cheering him every step of the way. You can see updates from Anthony as he trains and takes on the challenge via his Instagram page (@debandantrnuts) and Facebook page (www.facebook.com/threepeaks500). If you’d like to donate to Anthony’s epic challenge, you can do so via his JustGiving page.

Introduction

The Brain Tumour Data Dashboard lets you explore up -to-date, population level data about the brain tumours diagnosed in England between 2013 and 2015. Using the drop down menus on the left you can select different groups of patients to view in the charts below. In these charts the number of patients for every 100 diagnoses is displayed as images of people. Patients have been grouped by date of diagnosis, type of tumour, age, gender, and region in England.

For each group of patients you can explore the different routes to diagnosis, the proportion of those who received chemotherapy or radiotherapy, as well as the survival of the patients within each group. For more information about what these metrics mean please see the glossary.

How to use

  1. Select the year of diagnosis using the drop down menu.
  2. Select your patient group of interest from the four drop down menus in the following order:
    1. Tumour group
    2. Age at diagnosis
    3. Region of England
    4. Gender of patient
  3. To view a second chart to compare different groups of patients, click the ‘compare’ button.The second chart will appear below the first chart.

*Note that the tool is best used on a laptop or tablet rather than a mobile phone*

Unavailable data

Some of the data in these charts is not available.There are two main reasons for this:

  1. How the data has been grouped

If you cannot select a patient group from the drop down menus, the data is unavailable because of how the data has been organised.

Public Health England has grouped the data like a branching tree. The bottom of the tree contains all the patients with brain tumours, and then each branch divides the data by a certain characteristics, like age, or location of tumour. But the data is divided in an order, starting with location of the tumour (endocrine or brain), then by age, region, and gender. Age is at the start because it makes a bigger difference to survival rates and treatment rates than gender or region. Sometimes, after the data has been split by type of tumour and age, there is not enough data to be split again. This is because to protect patient confidentiality groups cannot contain less than 100 patients. Because some groups cannot be split further, you cannot create ‘totals’ for everyone by region or gender. For example, you cannot see results for all ages by region, or all brain tumours by gender. If these totals were calculated and released, it might be possible to identify patients, which is why Public Health England cannot release this data.

  1. Statistical reasons and data availability

If you can select a patient group from the chart menus, but the chart does not display, the data is unavailable for one of several reasons:

  1. Data is not yet available for the selected year from Public Health England.
  2. Data is not available because the data quality is too poor to release this statistic.
  3. Data is not available as the statistic is not appropriate for this group.
  4. Data is not available because the standard error of the estimate was greater than 20% and so the estimate has been supressed.

Up to date brain tumour data

Brain tumour data may influence the decisions you make about your care. Data also helps you understand the bigger picture, or landscape, in which you find yourself.

Brain tumour data and statistics influence the focus, and work of organisations like brainstrust. The information helps us to understand the scale and impact of the problems we are setting out to solve.

This tool helps you understand the landscape in which you find yourself having been diagnosed with a brain tumour. This landscape can be particularly tricky to navigate as there are many different types of brain tumour, all of which have a different impact.

The information you see represents the most up-to-date, official, population level brain tumour data available for England. Over time we will be adding to the brain tumour data available and publishing reports, with recommendations, as a result of what we learn from this data.

The data behind this content has come from Public Health England’s National Cancer Registration and Analysis Service (NCRAS) and is a direct result of the ‘Get Data Out’ project.

This project provides anonymised population level brain tumour data for public use in the form of standard output tables, accessible here: http://cancerdata.nhs.uk/standardoutput

Incidence

The number or rate (per head of population) of new cases of a disease diagnosed in a given population during a specified time period (usually a calendar year). The crude rate is the total number of cases divided by the mid-year population, usually expressed per 100,000 population.

Malignant

Malignant tumours which grow by invasion into surrounding tissues and have the ability to metastasise to distant sites

Mortality

The number or rate (per head of population) of deaths in a given population during a specified time period (usually a calendar year). The crude rate is the total number of deaths divided by the mid-year population, usually expressed per 100,000 population.

Non-malignant

Not cancerousNon-malignant tumours may grow larger but do not spread to other parts of the body.

Survival

The length of time from the date of diagnosis for a disease, such as cancer, that patients diagnosed with the disease are still alive. In a clinical trial, measuring the survival is one way to see how well a new treatment works. Also called ‘overall survival’ or ‘OS’.

Routes to Diagnosis

Under the ‘Routes to Diagnosis’ tab in the Brain Tumour Data Dashboard, you can explore the ways patients have been diagnosed with brain tumours. There are many ways, or routes, for cancers to be diagnosed in the NHS. A ‘route to diagnosis’ is the series of events between a patient and the healthcare system that leads to a diagnosis of cancer. The routes include:

  1. Two Week Wait

Patients are urgently referred by their GP for suspected cancer via the Two Week Wait system and are seen by a specialist within 2 weeks where they are diagnosed.

  1. GP referral

Diagnosis via a GP referral includes routine and urgent referrals where the patient was not referred under the Two Week Wait system.

  1. Emergency Presentation

Cancers can be diagnosed via emergency situations such as via A&E, emergency GP referral, emergency transfer or emergency admission.

  1. Outpatient

Outpatient cancer diagnoses include diagnoses via an elective route which started with an outpatient appointment that is either a self-referral or consultant to consultant referral. (It does not include those under the Two Week Wait referral system).

  1. Inpatient elective

Diagnosis via an inpatient elective route is where diagnosis occurs after the patient has been admitted into secondary care from a waiting list, or where the admission is booked or planned.

  1. Death Certificate Only

Diagnoses made by Death Certificate Only are made where there is no more information about the cancer diagnosis other than the cancer related death notifications. The date of diagnosis is the same as that of the date of death.

  1. Unknown

For some patients with a cancer diagnosis, there is no relevant data available to understand the route to diagnosis.


More information

If any of the statistical terms in this section of the brainstrust website are hard to understand, we recommend looking them up here:

Cancer Research UK’s Cancer Statistics Explained

http://www.cancerresearchuk.org/health-professional/cancer-statistics/cancer-stats-explained/statistics-terminology-explained#heading-Seven

If you are looking for help understanding terms relating specifically to brain tumours, and treatment, then the brainstrust glossary is available here:

https://www.brainstrust.org.uk/advice-glossary.php