In Fundraising, Fundraising News

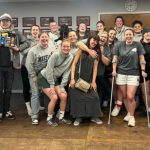
On 17 June, Helen and her team of ‘Peaky Bounders’ took on the UK 3 peaks challenge. The team set out to hike the UK’s 3 highest mountains in under 24 hours. They took on this epic challenge to raise vital funds for brainstrust, in this article Helen shares more about what motivated them to take on the challenge and how it went.


The National 3 Peaks Challenge has always been on my bucket list but somehow I had never got round to doing it. Then last year my 23-year-old son did it and I realised if I was going to do it,  it needed to be soon! I turned 60 in February so I decided to make it into a birthday celebration.

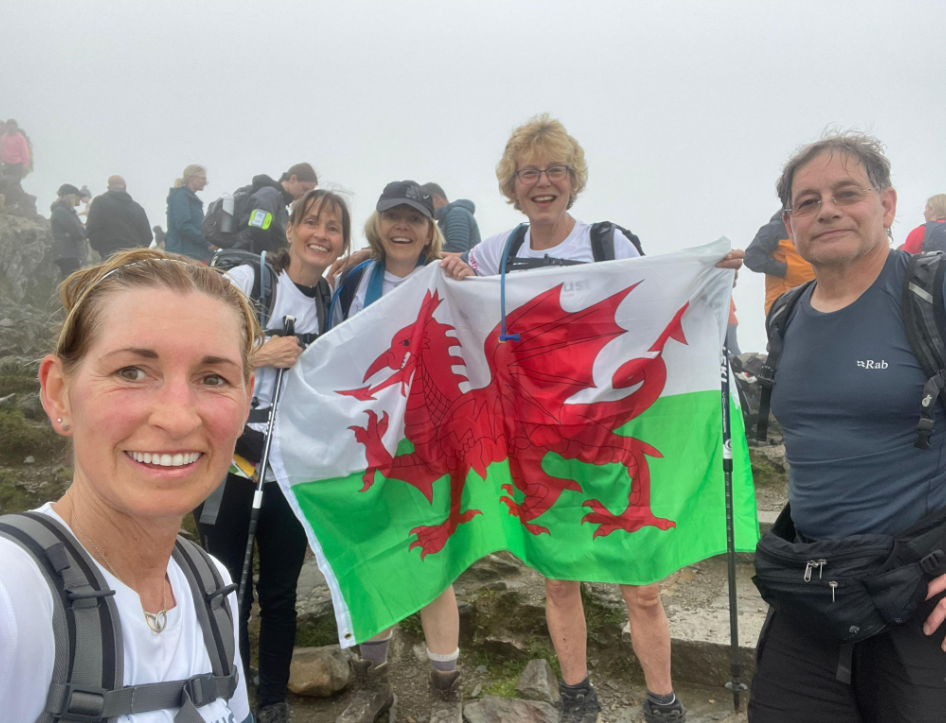
This has not been a trivial challenge for me to complete. 25 years ago I climbed Snowdon for the first time and I fell and broke my arm. If I had fallen off a ledge close by then I would not be here to tell my story. This challenge meant facing the fear of falling again. During our training, I climbed Snowdon for the first time since the accident, and then again during the challenge itself.


Walking for brainstrust

We chose brainstrust after one of our original walking team told us about his brother-in-law and how he recently had a brain tumour removed. The tumour and treatment had resulted in him experiencing character change and virtual blindness. This chap went from being Head of PE in a local school to being an invalid and needing a guide. He and his family struggled to get support so brainstrust seemed appropriate; by fundraising we could help make sure others get the support they need. Also, one of our guides works to support people with brain injuries to get legal help. We are overwhelmed by the contributions that people have made, and have heard so many personal stories about others who have suffered from brain tumours.


Preparing for the hike

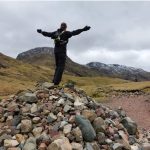
We did loads of training, visiting the mountains of North Wales and the Lake District every couple of months and increasing the scale of the challenge each time. We were motivated by our team dynamic and the fantastic scenery that we experienced.

When we set off, we knew that we were as ready as we could be!

Along with our training, we also did a lot of logistical planning. We chose to have a large minibus so that we had plenty of space and found two willing drivers. We’re so grateful to the drivers who were very organised and provided invaluable support. Not only did they drive, they heated up hot food for us after each mountain – a much better way to fuel ourselves!


Taking on the challenge

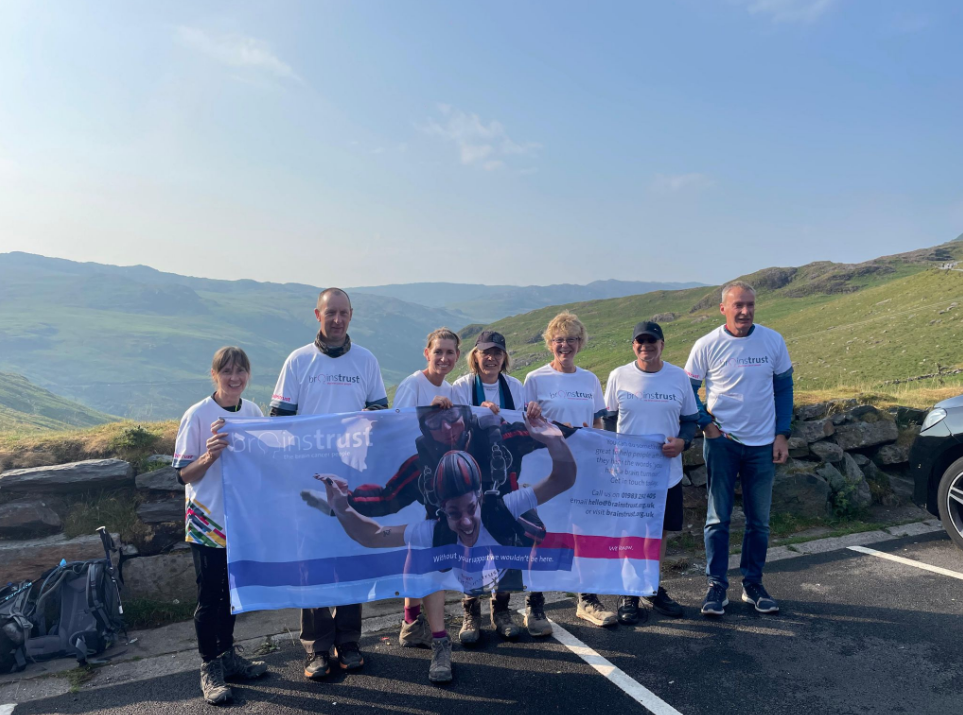
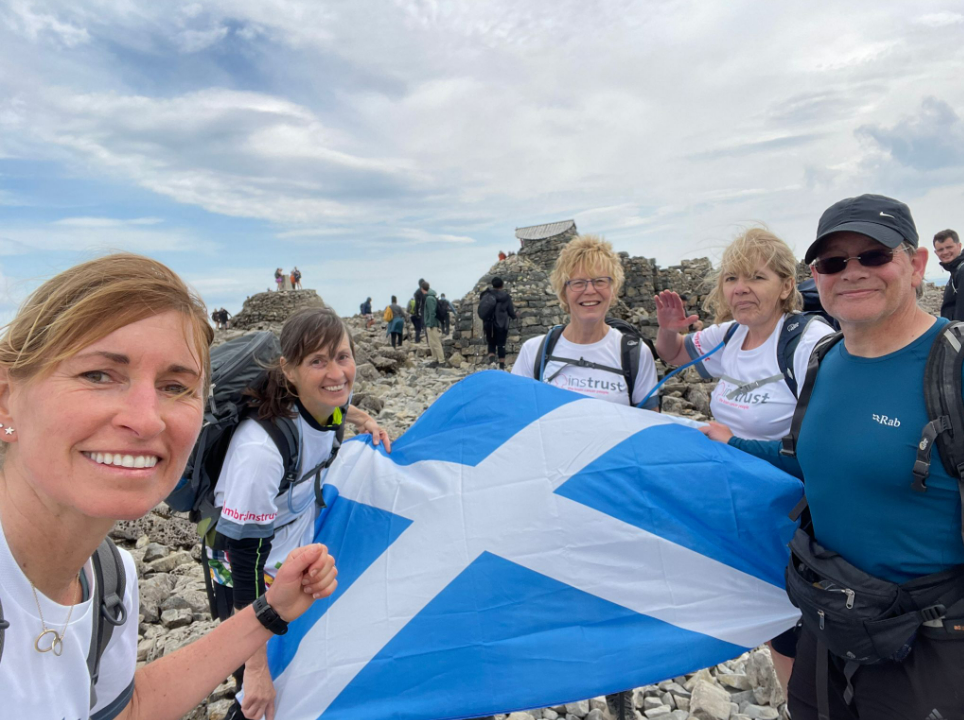
Ben Nevis was like Piccadilly Circus when we set off meaning we got delayed on the trek by other slower walkers. Even so, we managed to complete our first mountain in 5 hours 15 minutes, well within our target. Then we went straight onto Scafell Pike which we climbed at 7.30 pm – it was a beautiful experience as the sun went down. We drove through the night to Snowdon which we started at 4am so we could get back down by 8.08am.

In the end we completed the challenge in 23 hours 45 minutes which we were thrilled with!


We’d like to say a huge thank you to Helen and the Peaky Bounders for taking on this incredible challenge. Their commitment to training and the grit and motivation required to get up the final mountain at 4am is truly inspirational. So far, the fab team has raised over £3,000 for brainstrust – this money will go directly towards ensuring people diagnosed with a brain tumour have the support they need to live their best life possible after their diagnosis. You can see Helen’s fundraising page here.

Feeling inspired? Find out more about how you can fundraise for brainstrust here.

Introduction

The Brain Tumour Data Dashboard lets you explore up -to-date, population level data about the brain tumours diagnosed in England between 2013 and 2015. Using the drop down menus on the left you can select different groups of patients to view in the charts below. In these charts the number of patients for every 100 diagnoses is displayed as images of people. Patients have been grouped by date of diagnosis, type of tumour, age, gender, and region in England.

For each group of patients you can explore the different routes to diagnosis, the proportion of those who received chemotherapy or radiotherapy, as well as the survival of the patients within each group. For more information about what these metrics mean please see the glossary.

How to use

  1. Select the year of diagnosis using the drop down menu.
  2. Select your patient group of interest from the four drop down menus in the following order:
    1. Tumour group
    2. Age at diagnosis
    3. Region of England
    4. Gender of patient
  3. To view a second chart to compare different groups of patients, click the ‘compare’ button.The second chart will appear below the first chart.

*Note that the tool is best used on a laptop or tablet rather than a mobile phone*

Unavailable data

Some of the data in these charts is not available.There are two main reasons for this:

  1. How the data has been grouped

If you cannot select a patient group from the drop down menus, the data is unavailable because of how the data has been organised.

Public Health England has grouped the data like a branching tree. The bottom of the tree contains all the patients with brain tumours, and then each branch divides the data by a certain characteristics, like age, or location of tumour. But the data is divided in an order, starting with location of the tumour (endocrine or brain), then by age, region, and gender. Age is at the start because it makes a bigger difference to survival rates and treatment rates than gender or region. Sometimes, after the data has been split by type of tumour and age, there is not enough data to be split again. This is because to protect patient confidentiality groups cannot contain less than 100 patients. Because some groups cannot be split further, you cannot create ‘totals’ for everyone by region or gender. For example, you cannot see results for all ages by region, or all brain tumours by gender. If these totals were calculated and released, it might be possible to identify patients, which is why Public Health England cannot release this data.

  1. Statistical reasons and data availability

If you can select a patient group from the chart menus, but the chart does not display, the data is unavailable for one of several reasons:

  1. Data is not yet available for the selected year from Public Health England.
  2. Data is not available because the data quality is too poor to release this statistic.
  3. Data is not available as the statistic is not appropriate for this group.
  4. Data is not available because the standard error of the estimate was greater than 20% and so the estimate has been supressed.

Up to date brain tumour data

Brain tumour data may influence the decisions you make about your care. Data also helps you understand the bigger picture, or landscape, in which you find yourself.

Brain tumour data and statistics influence the focus, and work of organisations like brainstrust. The information helps us to understand the scale and impact of the problems we are setting out to solve.

This tool helps you understand the landscape in which you find yourself having been diagnosed with a brain tumour. This landscape can be particularly tricky to navigate as there are many different types of brain tumour, all of which have a different impact.

The information you see represents the most up-to-date, official, population level brain tumour data available for England. Over time we will be adding to the brain tumour data available and publishing reports, with recommendations, as a result of what we learn from this data.

The data behind this content has come from Public Health England’s National Cancer Registration and Analysis Service (NCRAS) and is a direct result of the ‘Get Data Out’ project.

This project provides anonymised population level brain tumour data for public use in the form of standard output tables, accessible here: http://cancerdata.nhs.uk/standardoutput

Incidence

The number or rate (per head of population) of new cases of a disease diagnosed in a given population during a specified time period (usually a calendar year). The crude rate is the total number of cases divided by the mid-year population, usually expressed per 100,000 population.

Malignant

Malignant tumours which grow by invasion into surrounding tissues and have the ability to metastasise to distant sites

Mortality

The number or rate (per head of population) of deaths in a given population during a specified time period (usually a calendar year). The crude rate is the total number of deaths divided by the mid-year population, usually expressed per 100,000 population.

Non-malignant

Not cancerousNon-malignant tumours may grow larger but do not spread to other parts of the body.

Survival

The length of time from the date of diagnosis for a disease, such as cancer, that patients diagnosed with the disease are still alive. In a clinical trial, measuring the survival is one way to see how well a new treatment works. Also called ‘overall survival’ or ‘OS’.

Routes to Diagnosis

Under the ‘Routes to Diagnosis’ tab in the Brain Tumour Data Dashboard, you can explore the ways patients have been diagnosed with brain tumours. There are many ways, or routes, for cancers to be diagnosed in the NHS. A ‘route to diagnosis’ is the series of events between a patient and the healthcare system that leads to a diagnosis of cancer. The routes include:

  1. Two Week Wait

Patients are urgently referred by their GP for suspected cancer via the Two Week Wait system and are seen by a specialist within 2 weeks where they are diagnosed.

  1. GP referral

Diagnosis via a GP referral includes routine and urgent referrals where the patient was not referred under the Two Week Wait system.

  1. Emergency Presentation

Cancers can be diagnosed via emergency situations such as via A&E, emergency GP referral, emergency transfer or emergency admission.

  1. Outpatient

Outpatient cancer diagnoses include diagnoses via an elective route which started with an outpatient appointment that is either a self-referral or consultant to consultant referral. (It does not include those under the Two Week Wait referral system).

  1. Inpatient elective

Diagnosis via an inpatient elective route is where diagnosis occurs after the patient has been admitted into secondary care from a waiting list, or where the admission is booked or planned.

  1. Death Certificate Only

Diagnoses made by Death Certificate Only are made where there is no more information about the cancer diagnosis other than the cancer related death notifications. The date of diagnosis is the same as that of the date of death.

  1. Unknown

For some patients with a cancer diagnosis, there is no relevant data available to understand the route to diagnosis.


More information

If any of the statistical terms in this section of the brainstrust website are hard to understand, we recommend looking them up here:

Cancer Research UK’s Cancer Statistics Explained

http://www.cancerresearchuk.org/health-professional/cancer-statistics/cancer-stats-explained/statistics-terminology-explained#heading-Seven

If you are looking for help understanding terms relating specifically to brain tumours, and treatment, then the brainstrust glossary is available here:

https://www.brainstrust.org.uk/advice-glossary.php