In Fundraising, Fundraising News

Carolyn joined us in September 2021 for Follow the Seagulls in Fife. We caught up with her as we prepare for Follow the Seagulls 2022 to find out more about why she chose to take on this challenging trek for brainstrust.

I turned 50 in 2020 during lockdown and wanted to take on a fundraising event with my son, David, in memory of my Dad who sadly died of a Glioblastoma brain tumour in 2019, aged 74. I have run numerous 10K’s but never ever contemplated walking 50 miles in 2 days so I wanted an event that would really challenge me.  The East Neuk of Fife is a family favourite as we holiday every year in Elie and my Dad is buried at St Monans so we have often walked along the Fife Coastal Path.

Follow the Seagulls is much more than a stroll in the park, with 50 miles to cover in just two days training is a must for our supporters. Carolyn explained how it felt for her:

“I am very fortunate that I run my own Doggy Day Care business and walk dogs five days a week but I also have my own black Labrador so was able to walk at least 10K each day.  I also found myself looking for new walks in and around Edinburgh which I had never done before which was amazing.  The final training walk I did with my son was from Edinburgh to South Queensferry.  I am very competitive so I wanted to get as fit as I could to ensure I completed Follow the Seagulls but I have to admit it was a challenge for me.

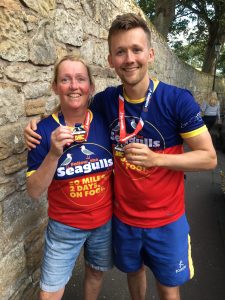
I had the most amazing weekend.  You couldn’t have written the script … my 50th was in lockdown and due to COVID last year’s walk was re-arranged from April to September and guess what day one was my 51st birthday!  Lovely Carol presented me with a birthday cake at 7.30am at St Andrews Bus Station!

Highlights for me were making new friends and the positive attitude of everyone who all had a reason for taking part.  On day two when everyone was tired we spurred each other on and we finished altogether as a team. I was super proud of what everyone achieved as it is no mean feat to walk 50 miles in 2 days.”

Top tips from Carolyn for this year’s walkers:

Definitely pack compeed, plenty of water and energy bars there are amazing places on the route to get fantastic food to re-charge your batteries which include Newport Bakery, Salt and Pine (crepes at Tentsmuir) and The Cheesy Toast Shack at Kingsbarns. I would strongly recommend having a support team (family and friends which I did) to meet you at each checkpoint who can pre-order any food required.

Without a doubt the toughest part of the walk was on day two after checkpoint four which is the final leg heading to St Andrews.  At points there was no path as you walk on the beach, I had to climb up and over rocks and the hardest part was the number of steps you had to climb as you manoeuvre up and down the cliff face.  You can see St Andrews to your right but with tired legs it was hard but with sheer grit and determination you can do it!

You cannot describe the satisfaction that you have managed to walk 50 miles in 2 days and have your family and a 12-week-old Labrador puppy waiting for you at the finishing line.  It is also lovely knowing how much you have raised through very generous family and friends for the amazing charity that is brainstrust.

Finally, we asked Carolyn, if you could give this year’s walkers one piece of advice or suggestion, what would it be?

Train hard but most importantly enjoy the whole experience.

We look forward to welcoming Carolyn back to Follow the Seagulls in Fife this April as a Volunteer Event Steward!

There’s still time to join up to Follow the Seagulls in Fife, Whitby (North Yorkshire), Dartmouth, and the Isle of Wight, just click here for further details!


Introduction

The Brain Tumour Data Dashboard lets you explore up -to-date, population level data about the brain tumours diagnosed in England between 2013 and 2015. Using the drop down menus on the left you can select different groups of patients to view in the charts below. In these charts the number of patients for every 100 diagnoses is displayed as images of people. Patients have been grouped by date of diagnosis, type of tumour, age, gender, and region in England.

For each group of patients you can explore the different routes to diagnosis, the proportion of those who received chemotherapy or radiotherapy, as well as the survival of the patients within each group. For more information about what these metrics mean please see the glossary.

How to use

  1. Select the year of diagnosis using the drop down menu.
  2. Select your patient group of interest from the four drop down menus in the following order:
    1. Tumour group
    2. Age at diagnosis
    3. Region of England
    4. Gender of patient
  3. To view a second chart to compare different groups of patients, click the ‘compare’ button.The second chart will appear below the first chart.

*Note that the tool is best used on a laptop or tablet rather than a mobile phone*

Unavailable data

Some of the data in these charts is not available.There are two main reasons for this:

  1. How the data has been grouped

If you cannot select a patient group from the drop down menus, the data is unavailable because of how the data has been organised.

Public Health England has grouped the data like a branching tree. The bottom of the tree contains all the patients with brain tumours, and then each branch divides the data by a certain characteristics, like age, or location of tumour. But the data is divided in an order, starting with location of the tumour (endocrine or brain), then by age, region, and gender. Age is at the start because it makes a bigger difference to survival rates and treatment rates than gender or region. Sometimes, after the data has been split by type of tumour and age, there is not enough data to be split again. This is because to protect patient confidentiality groups cannot contain less than 100 patients. Because some groups cannot be split further, you cannot create ‘totals’ for everyone by region or gender. For example, you cannot see results for all ages by region, or all brain tumours by gender. If these totals were calculated and released, it might be possible to identify patients, which is why Public Health England cannot release this data.

  1. Statistical reasons and data availability

If you can select a patient group from the chart menus, but the chart does not display, the data is unavailable for one of several reasons:

  1. Data is not yet available for the selected year from Public Health England.
  2. Data is not available because the data quality is too poor to release this statistic.
  3. Data is not available as the statistic is not appropriate for this group.
  4. Data is not available because the standard error of the estimate was greater than 20% and so the estimate has been supressed.

Up to date brain tumour data

Brain tumour data may influence the decisions you make about your care. Data also helps you understand the bigger picture, or landscape, in which you find yourself.

Brain tumour data and statistics influence the focus, and work of organisations like brainstrust. The information helps us to understand the scale and impact of the problems we are setting out to solve.

This tool helps you understand the landscape in which you find yourself having been diagnosed with a brain tumour. This landscape can be particularly tricky to navigate as there are many different types of brain tumour, all of which have a different impact.

The information you see represents the most up-to-date, official, population level brain tumour data available for England. Over time we will be adding to the brain tumour data available and publishing reports, with recommendations, as a result of what we learn from this data.

The data behind this content has come from Public Health England’s National Cancer Registration and Analysis Service (NCRAS) and is a direct result of the ‘Get Data Out’ project.

This project provides anonymised population level brain tumour data for public use in the form of standard output tables, accessible here: http://cancerdata.nhs.uk/standardoutput

Incidence

The number or rate (per head of population) of new cases of a disease diagnosed in a given population during a specified time period (usually a calendar year). The crude rate is the total number of cases divided by the mid-year population, usually expressed per 100,000 population.

Malignant

Malignant tumours which grow by invasion into surrounding tissues and have the ability to metastasise to distant sites

Mortality

The number or rate (per head of population) of deaths in a given population during a specified time period (usually a calendar year). The crude rate is the total number of deaths divided by the mid-year population, usually expressed per 100,000 population.

Non-malignant

Not cancerousNon-malignant tumours may grow larger but do not spread to other parts of the body.

Survival

The length of time from the date of diagnosis for a disease, such as cancer, that patients diagnosed with the disease are still alive. In a clinical trial, measuring the survival is one way to see how well a new treatment works. Also called ‘overall survival’ or ‘OS’.

Routes to Diagnosis

Under the ‘Routes to Diagnosis’ tab in the Brain Tumour Data Dashboard, you can explore the ways patients have been diagnosed with brain tumours. There are many ways, or routes, for cancers to be diagnosed in the NHS. A ‘route to diagnosis’ is the series of events between a patient and the healthcare system that leads to a diagnosis of cancer. The routes include:

  1. Two Week Wait

Patients are urgently referred by their GP for suspected cancer via the Two Week Wait system and are seen by a specialist within 2 weeks where they are diagnosed.

  1. GP referral

Diagnosis via a GP referral includes routine and urgent referrals where the patient was not referred under the Two Week Wait system.

  1. Emergency Presentation

Cancers can be diagnosed via emergency situations such as via A&E, emergency GP referral, emergency transfer or emergency admission.

  1. Outpatient

Outpatient cancer diagnoses include diagnoses via an elective route which started with an outpatient appointment that is either a self-referral or consultant to consultant referral. (It does not include those under the Two Week Wait referral system).

  1. Inpatient elective

Diagnosis via an inpatient elective route is where diagnosis occurs after the patient has been admitted into secondary care from a waiting list, or where the admission is booked or planned.

  1. Death Certificate Only

Diagnoses made by Death Certificate Only are made where there is no more information about the cancer diagnosis other than the cancer related death notifications. The date of diagnosis is the same as that of the date of death.

  1. Unknown

For some patients with a cancer diagnosis, there is no relevant data available to understand the route to diagnosis.


More information

If any of the statistical terms in this section of the brainstrust website are hard to understand, we recommend looking them up here:

Cancer Research UK’s Cancer Statistics Explained

http://www.cancerresearchuk.org/health-professional/cancer-statistics/cancer-stats-explained/statistics-terminology-explained#heading-Seven

If you are looking for help understanding terms relating specifically to brain tumours, and treatment, then the brainstrust glossary is available here:

https://www.brainstrust.org.uk/advice-glossary.php