In Charity News, Fundraising, Past Events
wgfad18 web banner

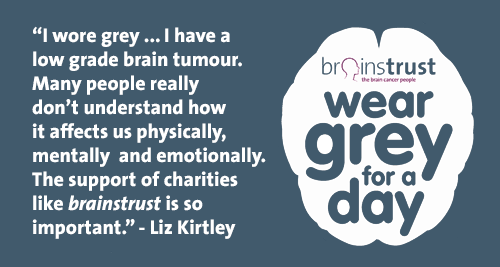
We’re turning the world grey to support people with brain tumours.

Wear Grey for a Day 2018

Over 15,000 people will be diagnosed with a brain tumour this year. That’s why every year on the 1st October we all Wear Grey to raise awareness of the invisible illness that is brain cancer. And this year is no different.

Since the launch of Wear Grey in 2011, together we have raised over £100,000 to support the brain tumour community. This year, thousands of people will come together to turn the world grey and show their support for people battling brain tumours, and to raise awareness of the challenges that life with a brain tumour brings.

Register for Wear Grey 2018

Signing up for Wear Grey is the first step, and it’s really easy. Just fill in the form below to order your welcome pack. It’s full of all the fundraising and awareness tools and ideas you need to make your Wear Grey event a huge success. Then on the 1st October, Wear Grey, and encourage as many of your friends, family and colleagues to do likewise.

Wearing Grey for brain tumours

Donate now

If you’d like to create a Just Giving page to support your Wear Grey event, this can be done through the Wear Grey 2018 campaign page.

Just click here and create your page today. You can also show your support to Wear Grey by visiting our website to donate, or you can text your donation, by texting WGRY18 £5 to 70070. Together, we can show our support to brain tumour patients, and raise awareness of this silent disease.

Shop now

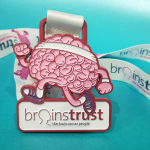
No Wear Grey event is complete without brainstrust’s Wear Grey t-shirts, pins or wristbands. There is a brand new t-shirt for 2018, which can be purchased from our online shop. We also have a variety of merchandise, such as wristbands and pin badges, ready for you to buy and sell at your Wear Grey event, so that everyone can show their support to brain tumour patients.

Register for your free Wear Grey 2018 pack today

Each pack contains stickers, awareness posters, a collection box and inspiring resources to make raising awareness and vital funds for brain tumour support on October 1st easier than it has ever been.

wear grey

Your personal data is very important to us because it allows us to help people living with a brain tumour. Your details will only be used by brainstrust in adherence to our privacy policy. We will never give your information to other organisations without first seeking your specific consent. You can manage your mailing preferences at any time on this page

Got a question?

If you’re having problems with registering for your Wear Grey pack, have a question about Wear Grey or your fundraising, then please get in touch. Call us on 01983 213 576, or email ryan@brainstrust.org.uk.


Liz Kirtley wears grey to raise awareness of brain tumours and their impact

Need more fundraising materials? Download them here and print at home!

Bake Sale Poster

Dress Down Poster

Donation Shopping List

Wear Grey for a Day 2018 poster

Facebook Profile Picture


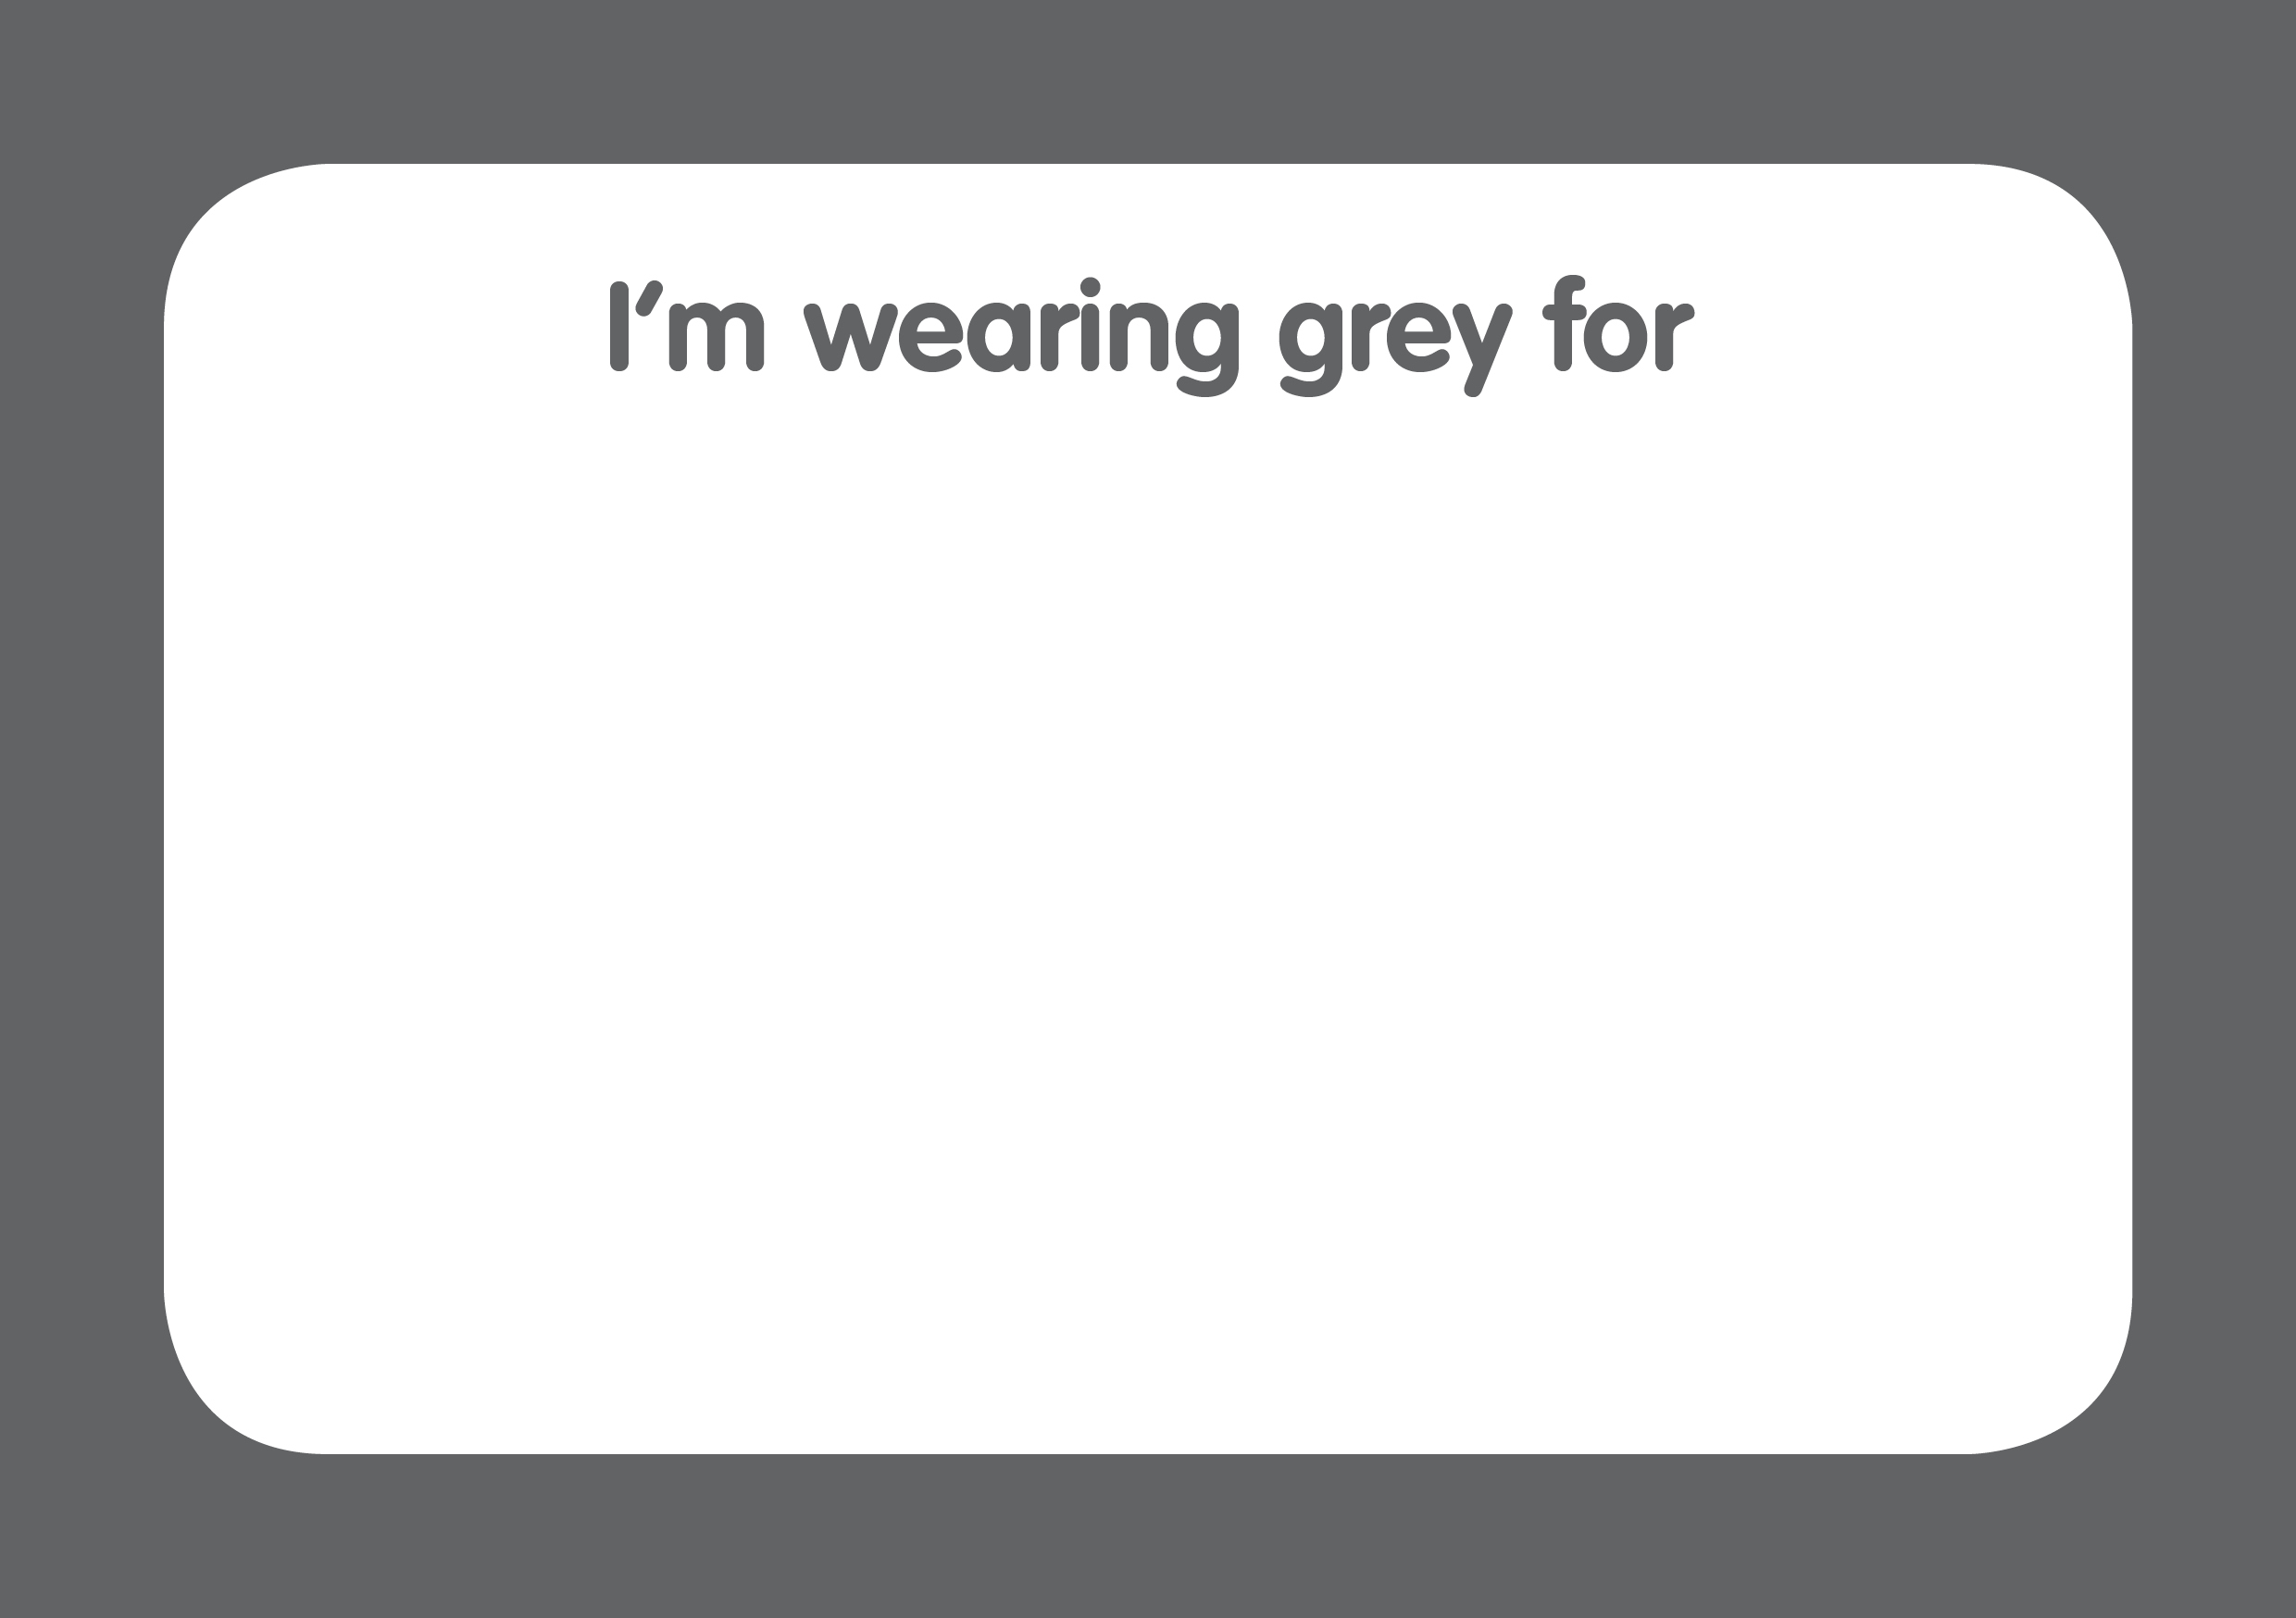
Sign for Wear Grey t-shirt. Print at home, and tell the world who you are wearing grey for.

Take Wear Grey to school or work

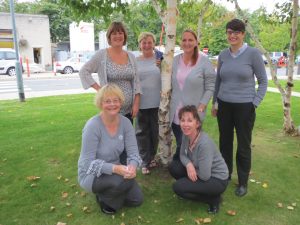
Every year, schools colleges and workplaces wear grey to raise awareness of the invisible challenges that come with a brain tumour diagnosis. This year we are delighted to be working alongside the following organisations:

Organisations

Schools

YGG Gwaun Car Gurwen
brainstrust medal 2 3

Introduction

The Brain Tumour Data Dashboard lets you explore up -to-date, population level data about the brain tumours diagnosed in England between 2013 and 2015. Using the drop down menus on the left you can select different groups of patients to view in the charts below. In these charts the number of patients for every 100 diagnoses is displayed as images of people. Patients have been grouped by date of diagnosis, type of tumour, age, gender, and region in England.

For each group of patients you can explore the different routes to diagnosis, the proportion of those who received chemotherapy or radiotherapy, as well as the survival of the patients within each group. For more information about what these metrics mean please see the glossary.

How to use

  1. Select the year of diagnosis using the drop down menu.
  2. Select your patient group of interest from the four drop down menus in the following order:
    1. Tumour group
    2. Age at diagnosis
    3. Region of England
    4. Gender of patient
  3. To view a second chart to compare different groups of patients, click the ‘compare’ button.The second chart will appear below the first chart.

*Note that the tool is best used on a laptop or tablet rather than a mobile phone*

Unavailable data

Some of the data in these charts is not available.There are two main reasons for this:

  1. How the data has been grouped

If you cannot select a patient group from the drop down menus, the data is unavailable because of how the data has been organised.

Public Health England has grouped the data like a branching tree. The bottom of the tree contains all the patients with brain tumours, and then each branch divides the data by a certain characteristics, like age, or location of tumour. But the data is divided in an order, starting with location of the tumour (endocrine or brain), then by age, region, and gender. Age is at the start because it makes a bigger difference to survival rates and treatment rates than gender or region. Sometimes, after the data has been split by type of tumour and age, there is not enough data to be split again. This is because to protect patient confidentiality groups cannot contain less than 100 patients. Because some groups cannot be split further, you cannot create ‘totals’ for everyone by region or gender. For example, you cannot see results for all ages by region, or all brain tumours by gender. If these totals were calculated and released, it might be possible to identify patients, which is why Public Health England cannot release this data.

  1. Statistical reasons and data availability

If you can select a patient group from the chart menus, but the chart does not display, the data is unavailable for one of several reasons:

  1. Data is not yet available for the selected year from Public Health England.
  2. Data is not available because the data quality is too poor to release this statistic.
  3. Data is not available as the statistic is not appropriate for this group.
  4. Data is not available because the standard error of the estimate was greater than 20% and so the estimate has been supressed.

Up to date brain tumour data

Brain tumour data may influence the decisions you make about your care. Data also helps you understand the bigger picture, or landscape, in which you find yourself.

Brain tumour data and statistics influence the focus, and work of organisations like brainstrust. The information helps us to understand the scale and impact of the problems we are setting out to solve.

This tool helps you understand the landscape in which you find yourself having been diagnosed with a brain tumour. This landscape can be particularly tricky to navigate as there are many different types of brain tumour, all of which have a different impact.

The information you see represents the most up-to-date, official, population level brain tumour data available for England. Over time we will be adding to the brain tumour data available and publishing reports, with recommendations, as a result of what we learn from this data.

The data behind this content has come from Public Health England’s National Cancer Registration and Analysis Service (NCRAS) and is a direct result of the ‘Get Data Out’ project.

This project provides anonymised population level brain tumour data for public use in the form of standard output tables, accessible here: http://cancerdata.nhs.uk/standardoutput

Incidence

The number or rate (per head of population) of new cases of a disease diagnosed in a given population during a specified time period (usually a calendar year). The crude rate is the total number of cases divided by the mid-year population, usually expressed per 100,000 population.

Malignant

Malignant tumours which grow by invasion into surrounding tissues and have the ability to metastasise to distant sites

Mortality

The number or rate (per head of population) of deaths in a given population during a specified time period (usually a calendar year). The crude rate is the total number of deaths divided by the mid-year population, usually expressed per 100,000 population.

Non-malignant

Not cancerousNon-malignant tumours may grow larger but do not spread to other parts of the body.

Survival

The length of time from the date of diagnosis for a disease, such as cancer, that patients diagnosed with the disease are still alive. In a clinical trial, measuring the survival is one way to see how well a new treatment works. Also called ‘overall survival’ or ‘OS’.

Routes to Diagnosis

Under the ‘Routes to Diagnosis’ tab in the Brain Tumour Data Dashboard, you can explore the ways patients have been diagnosed with brain tumours. There are many ways, or routes, for cancers to be diagnosed in the NHS. A ‘route to diagnosis’ is the series of events between a patient and the healthcare system that leads to a diagnosis of cancer. The routes include:

  1. Two Week Wait

Patients are urgently referred by their GP for suspected cancer via the Two Week Wait system and are seen by a specialist within 2 weeks where they are diagnosed.

  1. GP referral

Diagnosis via a GP referral includes routine and urgent referrals where the patient was not referred under the Two Week Wait system.

  1. Emergency Presentation

Cancers can be diagnosed via emergency situations such as via A&E, emergency GP referral, emergency transfer or emergency admission.

  1. Outpatient

Outpatient cancer diagnoses include diagnoses via an elective route which started with an outpatient appointment that is either a self-referral or consultant to consultant referral. (It does not include those under the Two Week Wait referral system).

  1. Inpatient elective

Diagnosis via an inpatient elective route is where diagnosis occurs after the patient has been admitted into secondary care from a waiting list, or where the admission is booked or planned.

  1. Death Certificate Only

Diagnoses made by Death Certificate Only are made where there is no more information about the cancer diagnosis other than the cancer related death notifications. The date of diagnosis is the same as that of the date of death.

  1. Unknown

For some patients with a cancer diagnosis, there is no relevant data available to understand the route to diagnosis.


More information

If any of the statistical terms in this section of the brainstrust website are hard to understand, we recommend looking them up here:

Cancer Research UK’s Cancer Statistics Explained

http://www.cancerresearchuk.org/health-professional/cancer-statistics/cancer-stats-explained/statistics-terminology-explained#heading-Seven

If you are looking for help understanding terms relating specifically to brain tumours, and treatment, then the brainstrust glossary is available here:

https://www.brainstrust.org.uk/advice-glossary.php