In Fundraising

Our celebration of the British cuppa for brain tumour support is over for another year and it really has been better than ever. Here are a few highlights from TEAFEST 2015-

Tracy Williams’ Tea Tasting spectacular attracted 70 of her friends! We think Tracy might hold the record for biggest TEAFEST party yet. Tracy put on a proper festival of tea, decorating her house to the nines and the good news is that her buntin managed to survive the gale-force weekend winds. And, even better news, Tracy’s party raised over £700. Incredible.
Thank you Tracy!

It seems like the British cuppa has gone global this year, with Tracy offering tastings of teas from around the world alongside it, and Cordula Stach’s TEAFEST party receiving donations from her international friends. Cordula saw donations for her party flood in from the UK, Germany, Mexico and Chile, collectively raising over £700. It’s great to see that the English brew, and more importantly brainstrust, is getting international support. Cordula, you’re amazing.

Mandy Smith held 2 TEAFEST events, one for her old teacher colleagues and their children, and another for family and neighbours. With 10 children arriving for the first party, all between ages 4 weeks and 4 years old, Mandy had a lively time of it. Her second party was more of a relaxed affair, where she enjoyed a cuppa whilst chatting about brainstrust. Together her two parties raised over £450 for brain tumour support! Thanks so much Mandy.

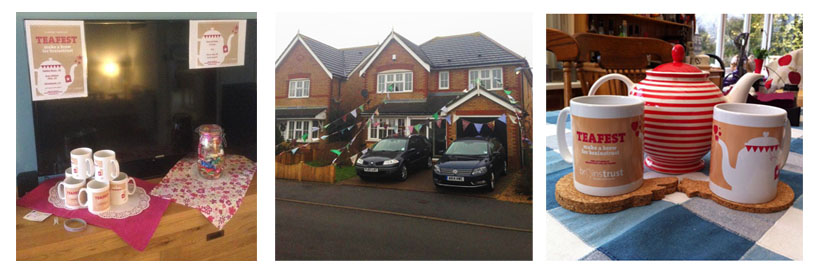
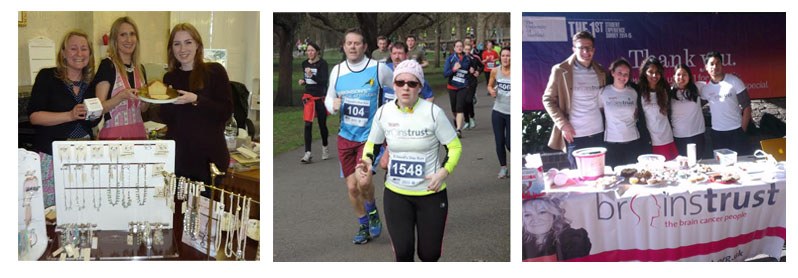
Brainstrust’s cooperate partners, Lovett and Co, opened up their vintage jewellery business to the people of Brighton and organised a drop-in day, with discounted accessories, cake and lots of TEAFEST merriment. They went onto raise over £100, and what’s more, two of the Lovett and Co girls have decided to run off the cake and sign up to run the Brighton 10K for brainstrust. You can sponsor them on their JustGiving Page.

Speaking of 10Ks, Suzanne Wag decided to fundraise for TEAFEST by competing in one, instead of drinking tea. Two years ago Suzanne raised an incredible £1000 for brainstrust at her TEAFEST party but this year she decided to do something more challenging, especially since her participation in the St. David’s Day Run fell almost exactly two after she had brain surgery. We applaud and admire Suzanne for choosing to race for brainstrust instead of eating cake and we’re thrilled to hear the first run she competed in since surgery went so well. You can still make a sponsorship donation towards Suzanne’s TEAFEST 10K HERE.

And finally, the University of Sheffield’s NeuroSoc had a lengthy list of ways they were going to fundraise for TEAFEST, and we’re pleased to announce that, through such hard work and tea-fuel, they were successful with everything. They sold out of goods at their Student Union cake sale, hit Friday evening rush hour at Sheffield train station on their bucket donation and saw a massive turn up and support for the pub quiz they hosted on Wednesday night. What an effort!

And these are just a few of the events that took place. Thank you to EVERYONE who got involved and donated this TEAFEST. The funds you raised will allow to continue building a support service to help more people in the UK feel less afraid, less alone and more in control in the face of a terrifying brain tumour diagnosis.

A brain tumour patient recently got in touch to thank brainstrust for her Brain Box, which featured a teabags in it alongide other vital information- a resoruce that is funded by the money you raise. Her words underline the importance of our help and how brain tumour support really is built on tea, not coffee-

“when I have a cup of tea I feel really supported. It feels full of love and I feel very cared for by your organisation”

If you missed out on TEAFEST this year, or want to continue fundraising, we have lots of events planned that you can involved with. Or, if you want to organise your own, we’ll support you with it every step of the way. Simply email your idea to tessa@brainstrust.org.uk Your fundraising is essential and will be used to help us reach the 60,000 people in the UK living with a brain tumour, so that we can offer them vital support.  


Introduction

The Brain Tumour Data Dashboard lets you explore up -to-date, population level data about the brain tumours diagnosed in England between 2013 and 2015. Using the drop down menus on the left you can select different groups of patients to view in the charts below. In these charts the number of patients for every 100 diagnoses is displayed as images of people. Patients have been grouped by date of diagnosis, type of tumour, age, gender, and region in England.

For each group of patients you can explore the different routes to diagnosis, the proportion of those who received chemotherapy or radiotherapy, as well as the survival of the patients within each group. For more information about what these metrics mean please see the glossary.

How to use

  1. Select the year of diagnosis using the drop down menu.
  2. Select your patient group of interest from the four drop down menus in the following order:
    1. Tumour group
    2. Age at diagnosis
    3. Region of England
    4. Gender of patient
  3. To view a second chart to compare different groups of patients, click the ‘compare’ button.The second chart will appear below the first chart.

*Note that the tool is best used on a laptop or tablet rather than a mobile phone*

Unavailable data

Some of the data in these charts is not available.There are two main reasons for this:

  1. How the data has been grouped

If you cannot select a patient group from the drop down menus, the data is unavailable because of how the data has been organised.

Public Health England has grouped the data like a branching tree. The bottom of the tree contains all the patients with brain tumours, and then each branch divides the data by a certain characteristics, like age, or location of tumour. But the data is divided in an order, starting with location of the tumour (endocrine or brain), then by age, region, and gender. Age is at the start because it makes a bigger difference to survival rates and treatment rates than gender or region. Sometimes, after the data has been split by type of tumour and age, there is not enough data to be split again. This is because to protect patient confidentiality groups cannot contain less than 100 patients. Because some groups cannot be split further, you cannot create ‘totals’ for everyone by region or gender. For example, you cannot see results for all ages by region, or all brain tumours by gender. If these totals were calculated and released, it might be possible to identify patients, which is why Public Health England cannot release this data.

  1. Statistical reasons and data availability

If you can select a patient group from the chart menus, but the chart does not display, the data is unavailable for one of several reasons:

  1. Data is not yet available for the selected year from Public Health England.
  2. Data is not available because the data quality is too poor to release this statistic.
  3. Data is not available as the statistic is not appropriate for this group.
  4. Data is not available because the standard error of the estimate was greater than 20% and so the estimate has been supressed.

Up to date brain tumour data

Brain tumour data may influence the decisions you make about your care. Data also helps you understand the bigger picture, or landscape, in which you find yourself.

Brain tumour data and statistics influence the focus, and work of organisations like brainstrust. The information helps us to understand the scale and impact of the problems we are setting out to solve.

This tool helps you understand the landscape in which you find yourself having been diagnosed with a brain tumour. This landscape can be particularly tricky to navigate as there are many different types of brain tumour, all of which have a different impact.

The information you see represents the most up-to-date, official, population level brain tumour data available for England. Over time we will be adding to the brain tumour data available and publishing reports, with recommendations, as a result of what we learn from this data.

The data behind this content has come from Public Health England’s National Cancer Registration and Analysis Service (NCRAS) and is a direct result of the ‘Get Data Out’ project.

This project provides anonymised population level brain tumour data for public use in the form of standard output tables, accessible here: http://cancerdata.nhs.uk/standardoutput

Incidence

The number or rate (per head of population) of new cases of a disease diagnosed in a given population during a specified time period (usually a calendar year). The crude rate is the total number of cases divided by the mid-year population, usually expressed per 100,000 population.

Malignant

Malignant tumours which grow by invasion into surrounding tissues and have the ability to metastasise to distant sites

Mortality

The number or rate (per head of population) of deaths in a given population during a specified time period (usually a calendar year). The crude rate is the total number of deaths divided by the mid-year population, usually expressed per 100,000 population.

Non-malignant

Not cancerousNon-malignant tumours may grow larger but do not spread to other parts of the body.

Survival

The length of time from the date of diagnosis for a disease, such as cancer, that patients diagnosed with the disease are still alive. In a clinical trial, measuring the survival is one way to see how well a new treatment works. Also called ‘overall survival’ or ‘OS’.

Routes to Diagnosis

Under the ‘Routes to Diagnosis’ tab in the Brain Tumour Data Dashboard, you can explore the ways patients have been diagnosed with brain tumours. There are many ways, or routes, for cancers to be diagnosed in the NHS. A ‘route to diagnosis’ is the series of events between a patient and the healthcare system that leads to a diagnosis of cancer. The routes include:

  1. Two Week Wait

Patients are urgently referred by their GP for suspected cancer via the Two Week Wait system and are seen by a specialist within 2 weeks where they are diagnosed.

  1. GP referral

Diagnosis via a GP referral includes routine and urgent referrals where the patient was not referred under the Two Week Wait system.

  1. Emergency Presentation

Cancers can be diagnosed via emergency situations such as via A&E, emergency GP referral, emergency transfer or emergency admission.

  1. Outpatient

Outpatient cancer diagnoses include diagnoses via an elective route which started with an outpatient appointment that is either a self-referral or consultant to consultant referral. (It does not include those under the Two Week Wait referral system).

  1. Inpatient elective

Diagnosis via an inpatient elective route is where diagnosis occurs after the patient has been admitted into secondary care from a waiting list, or where the admission is booked or planned.

  1. Death Certificate Only

Diagnoses made by Death Certificate Only are made where there is no more information about the cancer diagnosis other than the cancer related death notifications. The date of diagnosis is the same as that of the date of death.

  1. Unknown

For some patients with a cancer diagnosis, there is no relevant data available to understand the route to diagnosis.


More information

If any of the statistical terms in this section of the brainstrust website are hard to understand, we recommend looking them up here:

Cancer Research UK’s Cancer Statistics Explained

http://www.cancerresearchuk.org/health-professional/cancer-statistics/cancer-stats-explained/statistics-terminology-explained#heading-Seven

If you are looking for help understanding terms relating specifically to brain tumours, and treatment, then the brainstrust glossary is available here:

https://www.brainstrust.org.uk/advice-glossary.php