In Brain News

Getting enough sleep is important for everyone. When you’re suffering with fatigue as a result of your brain tumour, it is even more so. Unfortunately, knowing this can cause you to put pressure on yourself to sleep well, and this can mean your sleep is impacted even more! So, we have compiled some tips and advice to help you get a good night’s sleep.

With these tips, and using our fatigue resource, you can own your brain tumour fatigue.

How to sleep well

Did you know that the biggest impact on our ability to sleep well is alcohol, at 13.8%? This is followed closely by stress (12%) and caffeine (11.7%). This isn’t scientific research, but is the result of a survey run by The Times. But it makes sense. When we’re stressed we can sometimes use alcohol to help us relax and caffeine to give us a boost when we’re feeling less than ticketyboo.

Also – we actually sleep more than we think we do. We may not be as sleep deprived as we think we are – even during a restless night where you feel you haven’t slept at all, you will usually get a few hours. OK – it might not have been solid, transformative sleep. But it was sleep, including deep sleep.

So what are the small 1% changes you can make to help you sleep better?

Well, if you haven’t already, download our fatigue resource (or email hello@brainstrust.org.uk to ask for a hard copy) and have a good read of pages 16 – 34. There are some tiny actions outlined here that you could adopt that together would make a significance difference.

Other things that can improve the length and quality of your sleep include:

  • Exercise. Perhaps counterintuitively, regular exercise can help you to feel less tired. Where you can, try and avoid exercise at night
  • Reducing screen time. Avoiding phones and tablets for an at least an hour before bed can help, because the light exposure delays the release of melatonin.
  • Winding down. Dimming lighting, and activities such as having a warm (but not hot) bath, getting cozy and gentle relaxation like mindful breathing can all help to prepare you for sleep.
  • Having your evening meal early. Try to eat your dinner about 3 to 4 hours before bed. This impacts our body’s temperature – you’ll lose one degree so you are more able to sleep.

Sleep quiz – are you a lark or an owl?

Finding this out by taking part in this simple quiz can mean that you can adapt some of your daily activities to suit your own body clock:

A ‘digital’ medicine – Untire

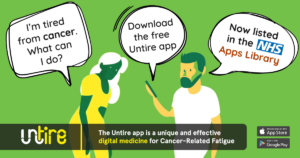
Untire is an app which helps you understand cancer fatigue, gives you exercises to reduce stress and tips to improve your mood and energy. The app was developed by a team of psychologists and psycho-oncology researchers. It’s mission?  To help as many people living with cancer as possible. Untire is free to download and is for everyone. You can find more information about the app on the website www.untire.me, watch this little video, or find out more about the background and the app in this video.

The good news? The Untire app has successfully passed the rigorous assessment with NHS digital and is now published on the NHS Apps Library.

teafest gtfest facebook banner 17.01.2020191210 205109 scaled

Introduction

The Brain Tumour Data Dashboard lets you explore up -to-date, population level data about the brain tumours diagnosed in England between 2013 and 2015. Using the drop down menus on the left you can select different groups of patients to view in the charts below. In these charts the number of patients for every 100 diagnoses is displayed as images of people. Patients have been grouped by date of diagnosis, type of tumour, age, gender, and region in England.

For each group of patients you can explore the different routes to diagnosis, the proportion of those who received chemotherapy or radiotherapy, as well as the survival of the patients within each group. For more information about what these metrics mean please see the glossary.

How to use

  1. Select the year of diagnosis using the drop down menu.
  2. Select your patient group of interest from the four drop down menus in the following order:
    1. Tumour group
    2. Age at diagnosis
    3. Region of England
    4. Gender of patient
  3. To view a second chart to compare different groups of patients, click the ‘compare’ button.The second chart will appear below the first chart.

*Note that the tool is best used on a laptop or tablet rather than a mobile phone*

Unavailable data

Some of the data in these charts is not available.There are two main reasons for this:

  1. How the data has been grouped

If you cannot select a patient group from the drop down menus, the data is unavailable because of how the data has been organised.

Public Health England has grouped the data like a branching tree. The bottom of the tree contains all the patients with brain tumours, and then each branch divides the data by a certain characteristics, like age, or location of tumour. But the data is divided in an order, starting with location of the tumour (endocrine or brain), then by age, region, and gender. Age is at the start because it makes a bigger difference to survival rates and treatment rates than gender or region. Sometimes, after the data has been split by type of tumour and age, there is not enough data to be split again. This is because to protect patient confidentiality groups cannot contain less than 100 patients. Because some groups cannot be split further, you cannot create ‘totals’ for everyone by region or gender. For example, you cannot see results for all ages by region, or all brain tumours by gender. If these totals were calculated and released, it might be possible to identify patients, which is why Public Health England cannot release this data.

  1. Statistical reasons and data availability

If you can select a patient group from the chart menus, but the chart does not display, the data is unavailable for one of several reasons:

  1. Data is not yet available for the selected year from Public Health England.
  2. Data is not available because the data quality is too poor to release this statistic.
  3. Data is not available as the statistic is not appropriate for this group.
  4. Data is not available because the standard error of the estimate was greater than 20% and so the estimate has been supressed.

Up to date brain tumour data

Brain tumour data may influence the decisions you make about your care. Data also helps you understand the bigger picture, or landscape, in which you find yourself.

Brain tumour data and statistics influence the focus, and work of organisations like brainstrust. The information helps us to understand the scale and impact of the problems we are setting out to solve.

This tool helps you understand the landscape in which you find yourself having been diagnosed with a brain tumour. This landscape can be particularly tricky to navigate as there are many different types of brain tumour, all of which have a different impact.

The information you see represents the most up-to-date, official, population level brain tumour data available for England. Over time we will be adding to the brain tumour data available and publishing reports, with recommendations, as a result of what we learn from this data.

The data behind this content has come from Public Health England’s National Cancer Registration and Analysis Service (NCRAS) and is a direct result of the ‘Get Data Out’ project.

This project provides anonymised population level brain tumour data for public use in the form of standard output tables, accessible here: http://cancerdata.nhs.uk/standardoutput

Incidence

The number or rate (per head of population) of new cases of a disease diagnosed in a given population during a specified time period (usually a calendar year). The crude rate is the total number of cases divided by the mid-year population, usually expressed per 100,000 population.

Malignant

Malignant tumours which grow by invasion into surrounding tissues and have the ability to metastasise to distant sites

Mortality

The number or rate (per head of population) of deaths in a given population during a specified time period (usually a calendar year). The crude rate is the total number of deaths divided by the mid-year population, usually expressed per 100,000 population.

Non-malignant

Not cancerousNon-malignant tumours may grow larger but do not spread to other parts of the body.

Survival

The length of time from the date of diagnosis for a disease, such as cancer, that patients diagnosed with the disease are still alive. In a clinical trial, measuring the survival is one way to see how well a new treatment works. Also called ‘overall survival’ or ‘OS’.

Routes to Diagnosis

Under the ‘Routes to Diagnosis’ tab in the Brain Tumour Data Dashboard, you can explore the ways patients have been diagnosed with brain tumours. There are many ways, or routes, for cancers to be diagnosed in the NHS. A ‘route to diagnosis’ is the series of events between a patient and the healthcare system that leads to a diagnosis of cancer. The routes include:

  1. Two Week Wait

Patients are urgently referred by their GP for suspected cancer via the Two Week Wait system and are seen by a specialist within 2 weeks where they are diagnosed.

  1. GP referral

Diagnosis via a GP referral includes routine and urgent referrals where the patient was not referred under the Two Week Wait system.

  1. Emergency Presentation

Cancers can be diagnosed via emergency situations such as via A&E, emergency GP referral, emergency transfer or emergency admission.

  1. Outpatient

Outpatient cancer diagnoses include diagnoses via an elective route which started with an outpatient appointment that is either a self-referral or consultant to consultant referral. (It does not include those under the Two Week Wait referral system).

  1. Inpatient elective

Diagnosis via an inpatient elective route is where diagnosis occurs after the patient has been admitted into secondary care from a waiting list, or where the admission is booked or planned.

  1. Death Certificate Only

Diagnoses made by Death Certificate Only are made where there is no more information about the cancer diagnosis other than the cancer related death notifications. The date of diagnosis is the same as that of the date of death.

  1. Unknown

For some patients with a cancer diagnosis, there is no relevant data available to understand the route to diagnosis.


More information

If any of the statistical terms in this section of the brainstrust website are hard to understand, we recommend looking them up here:

Cancer Research UK’s Cancer Statistics Explained

http://www.cancerresearchuk.org/health-professional/cancer-statistics/cancer-stats-explained/statistics-terminology-explained#heading-Seven

If you are looking for help understanding terms relating specifically to brain tumours, and treatment, then the brainstrust glossary is available here:

https://www.brainstrust.org.uk/advice-glossary.php