In Campaign News, Charity News

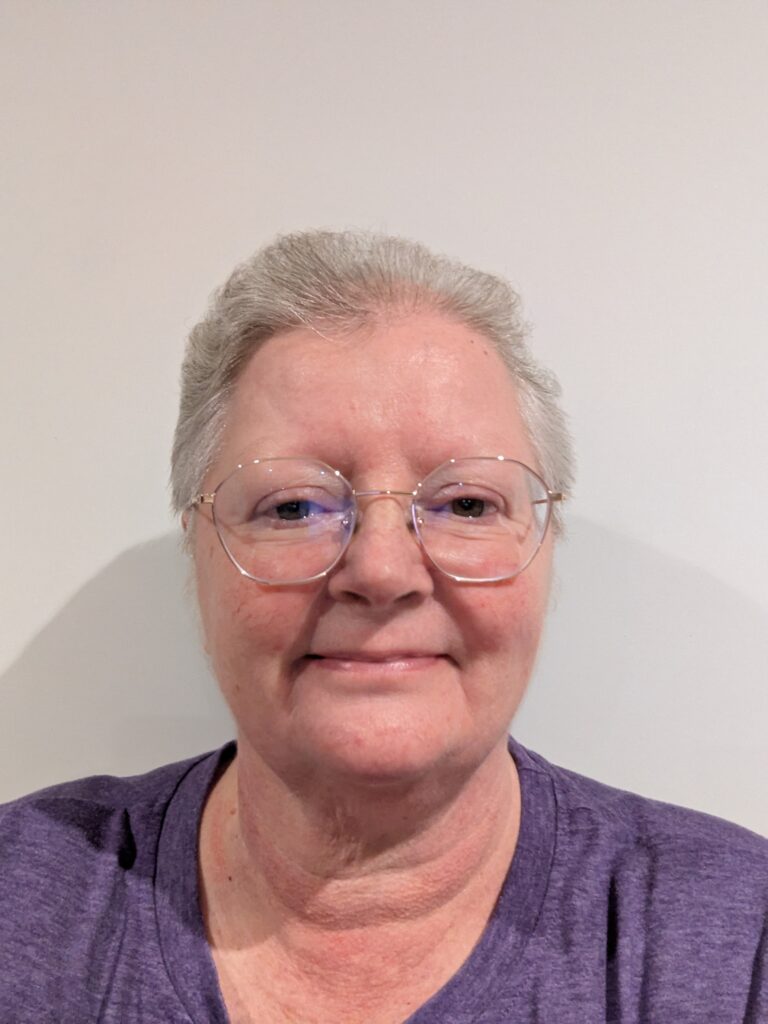
Crafting helps Sarah to manage her brain tumour anxiety

We’re advocating for creativity this Brain Tumour Awareness Month as we explore self-care for people living with a brain tumour. Sarah shares here how being creative has helped her to cope with her brain tumour diagnosis, and what other benefits she gets from crafting.

If you’d like to explore your creativity, come along to our next Art Time workshop in April!

The Great brainstrust Create-Off is our competition allowing people with a brain tumour to showcase their creative masterpieces. Open to all abilities, submit a piece you have created for a chance to win some prizes and feature in the brainstrust 2022 calendar. The deadline for submissions is the 31st March!

What sort of creative activities do you enjoy doing?

I have always enjoyed baking and decorating cakes, I always do cakes for my family’s birthdays.

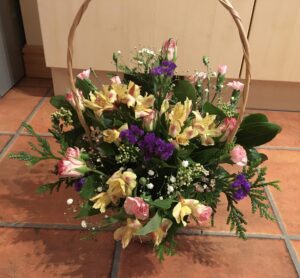
A few years ago I went to night school to learn floristry at the College I worked at, that was two hours a week that I found so relaxing as it was away from screens and the stresses of life and you could just sit and chat and learn a new skill.

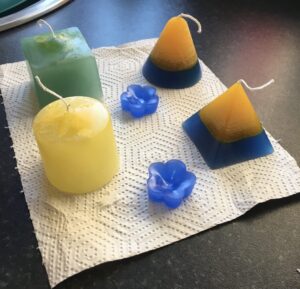
I taught myself from a kit how to make candles and from trial and error how to decorate bottles. I like making cards and I have taught myself since my brain surgery how to do die cutting and glass painting.

How did you find they helped you following your brain tumour diagnosis?

I have always liked doing crafts, but having that escapism really helped me when I was going through such a stressful time.

It’s very easy to sit and worry, so putting my energy in to making things and learning new things really helped to relax my mind. It gave me something to focus on rather than the worry of all the scans and then knowing I was going to have to have surgery to remove the meningioma.

I also liked going out for walks and taking my camera with me, I took lots of photos of animals, birds and scenery and then this gave me the idea of putting those into a calendar that I then had printed for Christmas presents for people, which is now something I do every year.

How does it make you feel once you have completed a new creative project or tried something new?

It makes me feel happy, especially if I have made something for someone as a gift. I have made a few presents now for people, and they always say how much they love them as I’ve taken the time to make something I think they would like.

I like to try new crafts, some are trickier to do than others but when you’ve made something and you’ve almost taught yourself how to do it, it does make you feel proud. I really struggled after my brain surgery to be able to follow instructions or to think of what I wanted to make, but that has turned in to a really good tool for recovery because it was a challenge and it made me learn new ways of understanding, and when I look back on how I have improved, that has helped my confidence.

What would you say to other people with a brain tumour who are wanting to start a creative activity but are unsure?

I would say go for it, there’s so many different types of crafts now that you are bound to find one or two that you really enjoy and there are so many resources available online that will help get you started. I have found lots of helpful tips online and have found YouTube quite handy as it’s helped me to see something visually to then go and try it out.

I’m not an arty person, I can’t draw anything but from trying things out and taking inspiration from things around me I can make things and when you do it gives you such a sense of achievement.

I would also say take photos of the things you make and then every now and again look back at them and you’ll be surprised at how much you’ve improved and how far you’ve come.

1 image guided surgery for brain tumours instagramDawn's glioblastoma story

Introduction

The Brain Tumour Data Dashboard lets you explore up -to-date, population level data about the brain tumours diagnosed in England between 2013 and 2015. Using the drop down menus on the left you can select different groups of patients to view in the charts below. In these charts the number of patients for every 100 diagnoses is displayed as images of people. Patients have been grouped by date of diagnosis, type of tumour, age, gender, and region in England.

For each group of patients you can explore the different routes to diagnosis, the proportion of those who received chemotherapy or radiotherapy, as well as the survival of the patients within each group. For more information about what these metrics mean please see the glossary.

How to use

  1. Select the year of diagnosis using the drop down menu.
  2. Select your patient group of interest from the four drop down menus in the following order:
    1. Tumour group
    2. Age at diagnosis
    3. Region of England
    4. Gender of patient
  3. To view a second chart to compare different groups of patients, click the ‘compare’ button.The second chart will appear below the first chart.

*Note that the tool is best used on a laptop or tablet rather than a mobile phone*

Unavailable data

Some of the data in these charts is not available.There are two main reasons for this:

  1. How the data has been grouped

If you cannot select a patient group from the drop down menus, the data is unavailable because of how the data has been organised.

Public Health England has grouped the data like a branching tree. The bottom of the tree contains all the patients with brain tumours, and then each branch divides the data by a certain characteristics, like age, or location of tumour. But the data is divided in an order, starting with location of the tumour (endocrine or brain), then by age, region, and gender. Age is at the start because it makes a bigger difference to survival rates and treatment rates than gender or region. Sometimes, after the data has been split by type of tumour and age, there is not enough data to be split again. This is because to protect patient confidentiality groups cannot contain less than 100 patients. Because some groups cannot be split further, you cannot create ‘totals’ for everyone by region or gender. For example, you cannot see results for all ages by region, or all brain tumours by gender. If these totals were calculated and released, it might be possible to identify patients, which is why Public Health England cannot release this data.

  1. Statistical reasons and data availability

If you can select a patient group from the chart menus, but the chart does not display, the data is unavailable for one of several reasons:

  1. Data is not yet available for the selected year from Public Health England.
  2. Data is not available because the data quality is too poor to release this statistic.
  3. Data is not available as the statistic is not appropriate for this group.
  4. Data is not available because the standard error of the estimate was greater than 20% and so the estimate has been supressed.

Up to date brain tumour data

Brain tumour data may influence the decisions you make about your care. Data also helps you understand the bigger picture, or landscape, in which you find yourself.

Brain tumour data and statistics influence the focus, and work of organisations like brainstrust. The information helps us to understand the scale and impact of the problems we are setting out to solve.

This tool helps you understand the landscape in which you find yourself having been diagnosed with a brain tumour. This landscape can be particularly tricky to navigate as there are many different types of brain tumour, all of which have a different impact.

The information you see represents the most up-to-date, official, population level brain tumour data available for England. Over time we will be adding to the brain tumour data available and publishing reports, with recommendations, as a result of what we learn from this data.

The data behind this content has come from Public Health England’s National Cancer Registration and Analysis Service (NCRAS) and is a direct result of the ‘Get Data Out’ project.

This project provides anonymised population level brain tumour data for public use in the form of standard output tables, accessible here: http://cancerdata.nhs.uk/standardoutput

Incidence

The number or rate (per head of population) of new cases of a disease diagnosed in a given population during a specified time period (usually a calendar year). The crude rate is the total number of cases divided by the mid-year population, usually expressed per 100,000 population.

Malignant

Malignant tumours which grow by invasion into surrounding tissues and have the ability to metastasise to distant sites

Mortality

The number or rate (per head of population) of deaths in a given population during a specified time period (usually a calendar year). The crude rate is the total number of deaths divided by the mid-year population, usually expressed per 100,000 population.

Non-malignant

Not cancerousNon-malignant tumours may grow larger but do not spread to other parts of the body.

Survival

The length of time from the date of diagnosis for a disease, such as cancer, that patients diagnosed with the disease are still alive. In a clinical trial, measuring the survival is one way to see how well a new treatment works. Also called ‘overall survival’ or ‘OS’.

Routes to Diagnosis

Under the ‘Routes to Diagnosis’ tab in the Brain Tumour Data Dashboard, you can explore the ways patients have been diagnosed with brain tumours. There are many ways, or routes, for cancers to be diagnosed in the NHS. A ‘route to diagnosis’ is the series of events between a patient and the healthcare system that leads to a diagnosis of cancer. The routes include:

  1. Two Week Wait

Patients are urgently referred by their GP for suspected cancer via the Two Week Wait system and are seen by a specialist within 2 weeks where they are diagnosed.

  1. GP referral

Diagnosis via a GP referral includes routine and urgent referrals where the patient was not referred under the Two Week Wait system.

  1. Emergency Presentation

Cancers can be diagnosed via emergency situations such as via A&E, emergency GP referral, emergency transfer or emergency admission.

  1. Outpatient

Outpatient cancer diagnoses include diagnoses via an elective route which started with an outpatient appointment that is either a self-referral or consultant to consultant referral. (It does not include those under the Two Week Wait referral system).

  1. Inpatient elective

Diagnosis via an inpatient elective route is where diagnosis occurs after the patient has been admitted into secondary care from a waiting list, or where the admission is booked or planned.

  1. Death Certificate Only

Diagnoses made by Death Certificate Only are made where there is no more information about the cancer diagnosis other than the cancer related death notifications. The date of diagnosis is the same as that of the date of death.

  1. Unknown

For some patients with a cancer diagnosis, there is no relevant data available to understand the route to diagnosis.


More information

If any of the statistical terms in this section of the brainstrust website are hard to understand, we recommend looking them up here:

Cancer Research UK’s Cancer Statistics Explained

http://www.cancerresearchuk.org/health-professional/cancer-statistics/cancer-stats-explained/statistics-terminology-explained#heading-Seven

If you are looking for help understanding terms relating specifically to brain tumours, and treatment, then the brainstrust glossary is available here:

https://www.brainstrust.org.uk/advice-glossary.php