In Campaign News, Charity News

The reason we Wear Grey

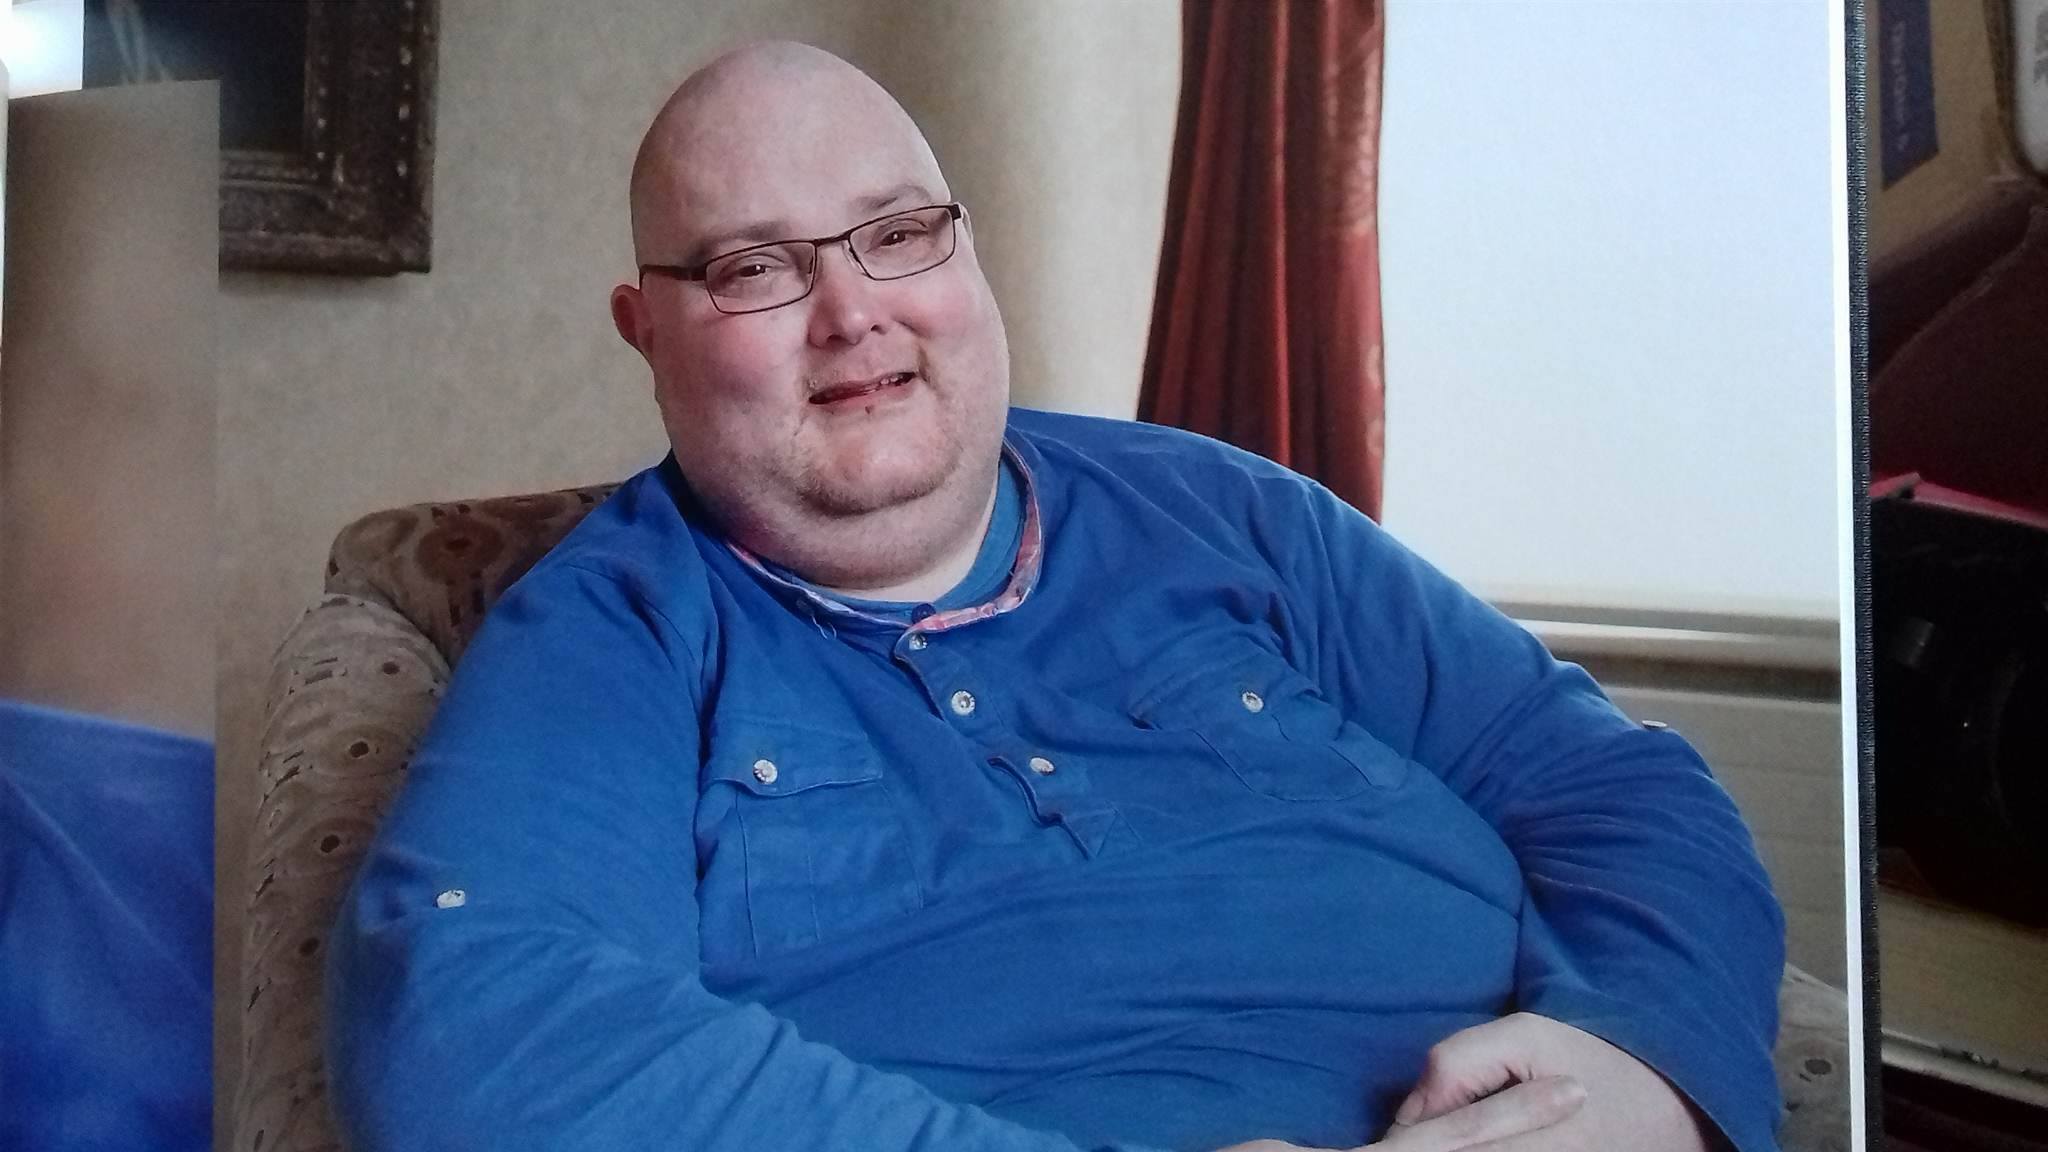
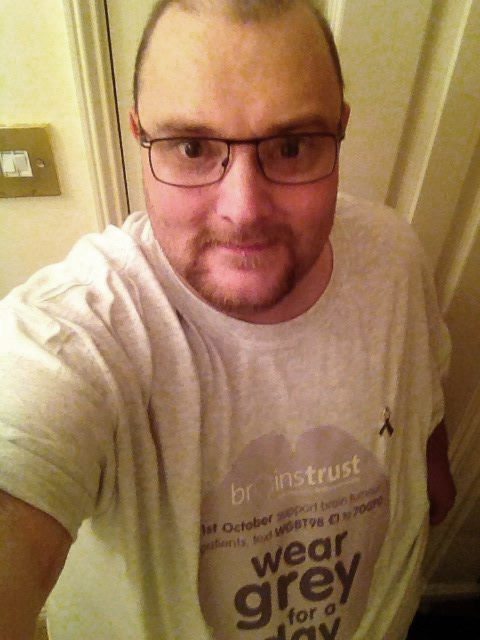
10 years ago, an amazing man named Shaun approached us with an idea: on the 1st of October he wanted to turn the world grey in support of people living with brain tumours.

Shaun had been diagnosed with a terminal brain tumour in 2007 and was a passionate advocate for the brain tumour community. He was inspired by ‘Go Gray for a Day’ in the US – it made sense to join the two events up, and with the US event in October, so Wear Grey was born.

Shaun sadly died in 2017 from his brain tumour and his humour, tenacity, and passion for advocating for the brain tumour community is deeply missed by so many. Shaun touched so many people with his work, and Wear Grey is an important part of his incredible legacy. In memory of Shaun, and of everyone whose life has been lost to or affected by a brain tumour, we continue to mark Wear Grey every year.

Shaun in the words of his family

We spoke to Bev, Shaun’s sister, who recently hosted a coffee and cake fundraiser in Shaun’s memory, and reflects on Shaun’s legacy both through Wear Grey and beyond. Her words sum up the amazing influence Shaun’s approach to life continues to have:
Shaun Skinner, my brother, was diagnosed with a brain tumour 15 years ago, I got the phone call from him to tell me when my youngest daughter was just 1 day old, I remember it vividly. Anyway, he was passionate about getting awareness for brain tumours out there & got involved with brainstrust, he did various things with people from brainstrust but he came up with the idea of starting ‘Wear Grey day’ over here, so on 1st October, 10 years ago, the first UK Wear grey day, was started. I am so proud of Shaun for doing that, I think people still needs to be made more aware of brain tumours as it’s still not as well know as some of the others & if it wasn’t for Shaun being involved then I wouldn’t know about Wear Grey day on 1st October.
Let me get back to what I should be saying. Shaun sadly passed away 5 years ago back in January, I have felt since then that I should be doing more to raise awareness of brain tumours & to raise money for the charity, I have in the past done a skydive to raise a little bit of money but on 21st May this year, Shaun would of been 50, so I couldn’t let that day go by without doing something to remember him, celebrate him & raise some money for brainstrust. Shaun liked his food and I would go out with him for coffee and he would enjoy a cake with it, so my idea was formed, no better way to celebrate his birthday that with an open house for people to come for coffee and cake. I planned it, invited people, made cakes and then the day arrived, it was a beautiful sunny Saturday, I had no idea how many people would come or how much money would be raised. Well what an afternoon, I must of had about 70 people in my garden, drinking and eating cake, something I know Shaun would have loved, it was amazing to see. At the end of it all when everything was tidied away, the money was added up and I was blown away, I couldn’t believe how generous people had been, people who had known Shaun and people who hadn’t, £776.35 was the grand total, all from people coming together, sitting in the sun, having a drink and eating cake. I hope it has been useful to the brainstrust charity. I want to thank all who supported. Still blown away now when I think about it.
The next thing will be 1st October, Wear Grey day, it’s easy to do, so come on everyone, let’s get awareness for brain tumours, it’s sufferers like my brother, families & friends of those living with a brain tumour out there & raise some well needed money for the brainstrust charity. Shaun I hope I did okay.”
Thank you to Bev for raising money for brainstrust in memory of Shaun, and for sharing her wonderful reflections on Shaun’s life and legacy.
To find out how you can get involved with Wear Grey, click here.

By signing up to our mailing list, you will receive all the latest news, events and resources straight to your inbox – helping make sure you are as well resourced and as informed as possible. 

Introduction

The Brain Tumour Data Dashboard lets you explore up -to-date, population level data about the brain tumours diagnosed in England between 2013 and 2015. Using the drop down menus on the left you can select different groups of patients to view in the charts below. In these charts the number of patients for every 100 diagnoses is displayed as images of people. Patients have been grouped by date of diagnosis, type of tumour, age, gender, and region in England.

For each group of patients you can explore the different routes to diagnosis, the proportion of those who received chemotherapy or radiotherapy, as well as the survival of the patients within each group. For more information about what these metrics mean please see the glossary.

How to use

  1. Select the year of diagnosis using the drop down menu.
  2. Select your patient group of interest from the four drop down menus in the following order:
    1. Tumour group
    2. Age at diagnosis
    3. Region of England
    4. Gender of patient
  3. To view a second chart to compare different groups of patients, click the ‘compare’ button.The second chart will appear below the first chart.

*Note that the tool is best used on a laptop or tablet rather than a mobile phone*

Unavailable data

Some of the data in these charts is not available.There are two main reasons for this:

  1. How the data has been grouped

If you cannot select a patient group from the drop down menus, the data is unavailable because of how the data has been organised.

Public Health England has grouped the data like a branching tree. The bottom of the tree contains all the patients with brain tumours, and then each branch divides the data by a certain characteristics, like age, or location of tumour. But the data is divided in an order, starting with location of the tumour (endocrine or brain), then by age, region, and gender. Age is at the start because it makes a bigger difference to survival rates and treatment rates than gender or region. Sometimes, after the data has been split by type of tumour and age, there is not enough data to be split again. This is because to protect patient confidentiality groups cannot contain less than 100 patients. Because some groups cannot be split further, you cannot create ‘totals’ for everyone by region or gender. For example, you cannot see results for all ages by region, or all brain tumours by gender. If these totals were calculated and released, it might be possible to identify patients, which is why Public Health England cannot release this data.

  1. Statistical reasons and data availability

If you can select a patient group from the chart menus, but the chart does not display, the data is unavailable for one of several reasons:

  1. Data is not yet available for the selected year from Public Health England.
  2. Data is not available because the data quality is too poor to release this statistic.
  3. Data is not available as the statistic is not appropriate for this group.
  4. Data is not available because the standard error of the estimate was greater than 20% and so the estimate has been supressed.

Up to date brain tumour data

Brain tumour data may influence the decisions you make about your care. Data also helps you understand the bigger picture, or landscape, in which you find yourself.

Brain tumour data and statistics influence the focus, and work of organisations like brainstrust. The information helps us to understand the scale and impact of the problems we are setting out to solve.

This tool helps you understand the landscape in which you find yourself having been diagnosed with a brain tumour. This landscape can be particularly tricky to navigate as there are many different types of brain tumour, all of which have a different impact.

The information you see represents the most up-to-date, official, population level brain tumour data available for England. Over time we will be adding to the brain tumour data available and publishing reports, with recommendations, as a result of what we learn from this data.

The data behind this content has come from Public Health England’s National Cancer Registration and Analysis Service (NCRAS) and is a direct result of the ‘Get Data Out’ project.

This project provides anonymised population level brain tumour data for public use in the form of standard output tables, accessible here: http://cancerdata.nhs.uk/standardoutput

Incidence

The number or rate (per head of population) of new cases of a disease diagnosed in a given population during a specified time period (usually a calendar year). The crude rate is the total number of cases divided by the mid-year population, usually expressed per 100,000 population.

Malignant

Malignant tumours which grow by invasion into surrounding tissues and have the ability to metastasise to distant sites

Mortality

The number or rate (per head of population) of deaths in a given population during a specified time period (usually a calendar year). The crude rate is the total number of deaths divided by the mid-year population, usually expressed per 100,000 population.

Non-malignant

Not cancerousNon-malignant tumours may grow larger but do not spread to other parts of the body.

Survival

The length of time from the date of diagnosis for a disease, such as cancer, that patients diagnosed with the disease are still alive. In a clinical trial, measuring the survival is one way to see how well a new treatment works. Also called ‘overall survival’ or ‘OS’.

Routes to Diagnosis

Under the ‘Routes to Diagnosis’ tab in the Brain Tumour Data Dashboard, you can explore the ways patients have been diagnosed with brain tumours. There are many ways, or routes, for cancers to be diagnosed in the NHS. A ‘route to diagnosis’ is the series of events between a patient and the healthcare system that leads to a diagnosis of cancer. The routes include:

  1. Two Week Wait

Patients are urgently referred by their GP for suspected cancer via the Two Week Wait system and are seen by a specialist within 2 weeks where they are diagnosed.

  1. GP referral

Diagnosis via a GP referral includes routine and urgent referrals where the patient was not referred under the Two Week Wait system.

  1. Emergency Presentation

Cancers can be diagnosed via emergency situations such as via A&E, emergency GP referral, emergency transfer or emergency admission.

  1. Outpatient

Outpatient cancer diagnoses include diagnoses via an elective route which started with an outpatient appointment that is either a self-referral or consultant to consultant referral. (It does not include those under the Two Week Wait referral system).

  1. Inpatient elective

Diagnosis via an inpatient elective route is where diagnosis occurs after the patient has been admitted into secondary care from a waiting list, or where the admission is booked or planned.

  1. Death Certificate Only

Diagnoses made by Death Certificate Only are made where there is no more information about the cancer diagnosis other than the cancer related death notifications. The date of diagnosis is the same as that of the date of death.

  1. Unknown

For some patients with a cancer diagnosis, there is no relevant data available to understand the route to diagnosis.


More information

If any of the statistical terms in this section of the brainstrust website are hard to understand, we recommend looking them up here:

Cancer Research UK’s Cancer Statistics Explained

http://www.cancerresearchuk.org/health-professional/cancer-statistics/cancer-stats-explained/statistics-terminology-explained#heading-Seven

If you are looking for help understanding terms relating specifically to brain tumours, and treatment, then the brainstrust glossary is available here:

https://www.brainstrust.org.uk/advice-glossary.php