Debbie’s story

Debbie was still recovering from a traumatic illness in 2009 when she experienced further upheaval with a brain tumour diagnosis. Despite this, Debbie is now a Brainstrust peer supporter who is keen to share her extensive experience of living with a brain tumour, as outlined below.

After complaining of horrible post-headache sickness (like “a bad hangover”) and frequently falling over, in March 2012, Debbie’s GP shockingly told her about the tumour. This was followed by an appointment with a NHS consultant neurosurgeon, who believed the tumour was non-cancerous.

The hope of the initial surgery

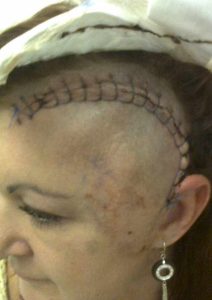
Just before her birthday, in July 2012, Debbie was hospitalized for 5 days after her first surgery. Debbie was left with a few reminders of the 10-hour operation like a skull indentation due to the introduced titanium mesh. However, she managed to return to work three months post- surgery.

The neurosurgeon thought the entire tumour, a meningioma, was removed. A meningioma originates in the layers of tissue that cover the brain and the spinal cord. According to Cancer Research UK, it is the most common type of benign tumour diagnosed in the UK.

The second op takes a greater toll

A long while after the initial surgery, Debbie started to feel unwell again. Unfortunately, as the tumour had grown again, she had to undergo a second operation, which took a greater toll on Debbie, so she had to give up work.

In this instance, the surgeon was certain that part of the tumour could not be touched without causing serious damage. Radiotherapy was considered but due to the positioning of the remaining tumour, there was a risk of leading to a neurodegenerative disease like Alzheimer’s.

The third surgery was the hardest

Unfortunately, her meningioma “is a bit of grower”, according to Debbie so she faced her third surgery in 2023. This time, the surgeon went in to remove sinuses and to compact the throat so the tumour didn’t grow into the stomach. Apart from feeling quite sick after the operation, it also resulted in cerebrospinal fluid in her middle ear drum.

Debbie is waiting for results due in April 2024 before yet another surgery to remove as much of the meningioma she named Bob the Builder, as he keeps her up all night and gives her headaches!

Debbie, the Peer Supporter

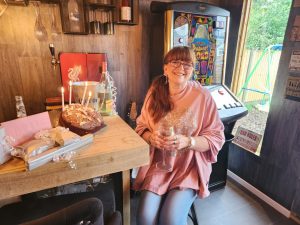
Debbie is usually quite independent and just “gets on with it”. However, she felt the need for support, particularly in between medical appointments, motivating her to become a peer supporter.  Find out about our Peer Support service here. Involved in charitable work since her childhood days, Debbie enjoys being a supporter to other patients, lovingly nicknamed as her “brain buddies”. brainstrust support specialists put her in touch with patients struggling with different parts of their brain tumour journey.

As a good listener and a people person, the down-to-earth peer supporter is in touch with patients from Northern Ireland to Dubai.  Despite living with the scars of battling her meningioma, Debbie still remains with a positive outlook: “Even if you have a tumour that you can’t get rid of… keep going, keep smiling!”

Other brainstrust support available to patients include face-to-face and online meetups with other sufferers.  In fact, in the early days Brainstrust, Debbie found it useful to attend meetups to talk about her feelings and not to feel so alone. Recently, she attended brainstrust’s Meningioma Matters online meetup for the first time, after which a patient reached out to speak with her.


Introduction

The Brain Tumour Data Dashboard lets you explore up -to-date, population level data about the brain tumours diagnosed in England between 2013 and 2015. Using the drop down menus on the left you can select different groups of patients to view in the charts below. In these charts the number of patients for every 100 diagnoses is displayed as images of people. Patients have been grouped by date of diagnosis, type of tumour, age, gender, and region in England.

For each group of patients you can explore the different routes to diagnosis, the proportion of those who received chemotherapy or radiotherapy, as well as the survival of the patients within each group. For more information about what these metrics mean please see the glossary.

How to use

  1. Select the year of diagnosis using the drop down menu.
  2. Select your patient group of interest from the four drop down menus in the following order:
    1. Tumour group
    2. Age at diagnosis
    3. Region of England
    4. Gender of patient
  3. To view a second chart to compare different groups of patients, click the ‘compare’ button.The second chart will appear below the first chart.

*Note that the tool is best used on a laptop or tablet rather than a mobile phone*

Unavailable data

Some of the data in these charts is not available.There are two main reasons for this:

  1. How the data has been grouped

If you cannot select a patient group from the drop down menus, the data is unavailable because of how the data has been organised.

Public Health England has grouped the data like a branching tree. The bottom of the tree contains all the patients with brain tumours, and then each branch divides the data by a certain characteristics, like age, or location of tumour. But the data is divided in an order, starting with location of the tumour (endocrine or brain), then by age, region, and gender. Age is at the start because it makes a bigger difference to survival rates and treatment rates than gender or region. Sometimes, after the data has been split by type of tumour and age, there is not enough data to be split again. This is because to protect patient confidentiality groups cannot contain less than 100 patients. Because some groups cannot be split further, you cannot create ‘totals’ for everyone by region or gender. For example, you cannot see results for all ages by region, or all brain tumours by gender. If these totals were calculated and released, it might be possible to identify patients, which is why Public Health England cannot release this data.

  1. Statistical reasons and data availability

If you can select a patient group from the chart menus, but the chart does not display, the data is unavailable for one of several reasons:

  1. Data is not yet available for the selected year from Public Health England.
  2. Data is not available because the data quality is too poor to release this statistic.
  3. Data is not available as the statistic is not appropriate for this group.
  4. Data is not available because the standard error of the estimate was greater than 20% and so the estimate has been supressed.

Up to date brain tumour data

Brain tumour data may influence the decisions you make about your care. Data also helps you understand the bigger picture, or landscape, in which you find yourself.

Brain tumour data and statistics influence the focus, and work of organisations like brainstrust. The information helps us to understand the scale and impact of the problems we are setting out to solve.

This tool helps you understand the landscape in which you find yourself having been diagnosed with a brain tumour. This landscape can be particularly tricky to navigate as there are many different types of brain tumour, all of which have a different impact.

The information you see represents the most up-to-date, official, population level brain tumour data available for England. Over time we will be adding to the brain tumour data available and publishing reports, with recommendations, as a result of what we learn from this data.

The data behind this content has come from Public Health England’s National Cancer Registration and Analysis Service (NCRAS) and is a direct result of the ‘Get Data Out’ project.

This project provides anonymised population level brain tumour data for public use in the form of standard output tables, accessible here: http://cancerdata.nhs.uk/standardoutput

Incidence

The number or rate (per head of population) of new cases of a disease diagnosed in a given population during a specified time period (usually a calendar year). The crude rate is the total number of cases divided by the mid-year population, usually expressed per 100,000 population.

Malignant

Malignant tumours which grow by invasion into surrounding tissues and have the ability to metastasise to distant sites

Mortality

The number or rate (per head of population) of deaths in a given population during a specified time period (usually a calendar year). The crude rate is the total number of deaths divided by the mid-year population, usually expressed per 100,000 population.

Non-malignant

Not cancerousNon-malignant tumours may grow larger but do not spread to other parts of the body.

Survival

The length of time from the date of diagnosis for a disease, such as cancer, that patients diagnosed with the disease are still alive. In a clinical trial, measuring the survival is one way to see how well a new treatment works. Also called ‘overall survival’ or ‘OS’.

Routes to Diagnosis

Under the ‘Routes to Diagnosis’ tab in the Brain Tumour Data Dashboard, you can explore the ways patients have been diagnosed with brain tumours. There are many ways, or routes, for cancers to be diagnosed in the NHS. A ‘route to diagnosis’ is the series of events between a patient and the healthcare system that leads to a diagnosis of cancer. The routes include:

  1. Two Week Wait

Patients are urgently referred by their GP for suspected cancer via the Two Week Wait system and are seen by a specialist within 2 weeks where they are diagnosed.

  1. GP referral

Diagnosis via a GP referral includes routine and urgent referrals where the patient was not referred under the Two Week Wait system.

  1. Emergency Presentation

Cancers can be diagnosed via emergency situations such as via A&E, emergency GP referral, emergency transfer or emergency admission.

  1. Outpatient

Outpatient cancer diagnoses include diagnoses via an elective route which started with an outpatient appointment that is either a self-referral or consultant to consultant referral. (It does not include those under the Two Week Wait referral system).

  1. Inpatient elective

Diagnosis via an inpatient elective route is where diagnosis occurs after the patient has been admitted into secondary care from a waiting list, or where the admission is booked or planned.

  1. Death Certificate Only

Diagnoses made by Death Certificate Only are made where there is no more information about the cancer diagnosis other than the cancer related death notifications. The date of diagnosis is the same as that of the date of death.

  1. Unknown

For some patients with a cancer diagnosis, there is no relevant data available to understand the route to diagnosis.


More information

If any of the statistical terms in this section of the brainstrust website are hard to understand, we recommend looking them up here:

Cancer Research UK’s Cancer Statistics Explained

http://www.cancerresearchuk.org/health-professional/cancer-statistics/cancer-stats-explained/statistics-terminology-explained#heading-Seven

If you are looking for help understanding terms relating specifically to brain tumours, and treatment, then the brainstrust glossary is available here:

https://www.brainstrust.org.uk/advice-glossary.php