In Charity News, Do your own thing, Events, Past Events

Legacy Festival Returns!

Legacy Festival is an annual three-day event organised by Lyndsey Rowe, founder of Lloyd’s Legacy. As a lasting tribute to her son, Legacy Festival brings people together to celebrate the good times with a focus on live music, good food and a field full of campers and vanpers (that’s campervans with a tent attached to those of us not in the know). It’s a popular event which sees people return year on year whilst attracting ever larger new audiences too. After a year away due to Coronavirus restrictions, this July Legacy Festival returned with a bang! Our Head of Income, Tom travelled down to a field in Eastleigh to muck in and experience everything for himself. Read Tom’s story below:

Glorious Friday!

After a few false-starts and the delay of “Freedom Day”, the fate of the festival had been in the balance for a second year running. But as I pulled into Highbridge Farm on Friday morning, I was immediately impressed by the scale of the event that was to come. The mainstage gave me Glastonbury vibes and I knew immediately that this was going to be a weekend to remember! Hard to believe that there had been a scramble to get everything rearranged in such a short space of time.

I met Lyndsey and her team, many of whom are friends and family that have been involved for years, and the passion they had for the event was palpable. Marquees, bars, kids inflatables, games and food stalls were taking shape, all with the capability to accommodate social distancing. I couldn’t help but get a tingle of excitement to be at an event of this scale after such long periods of various lockdowns and restrictions.

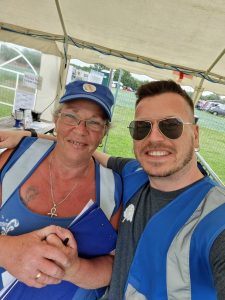
You don’t have hayfever do you?

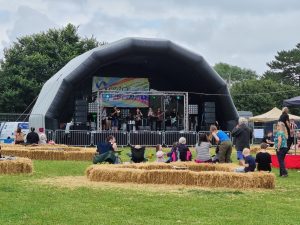
I said I was here to muck in and was soon put to work, helping assemble bags of branded t-shirts, masks and festival information for the raft of volunteers that were involved. We put up some brainstrust banners across the site that Lyndsey had asked me to bring before moving on to arranging a small mountain of hay bales into seating areas. In glorious south coast sunshine, it’s fair to say this was warm work! The result was areas where families and friends could be together whilst potentially distancing themselves from other groups, with a large open dancefloor area in front of the stage with plenty of space for everyone.


Keep it clean

With Covid safety very much at the forefront of everyone’s minds I filled and installed hand sanitisers across the site – bright blue in keeping with the festival colours. There were so many little jobs that took up the morning, making sure it was safe for the hundreds of imminent visitors, that before I knew it, the gates were due to open.

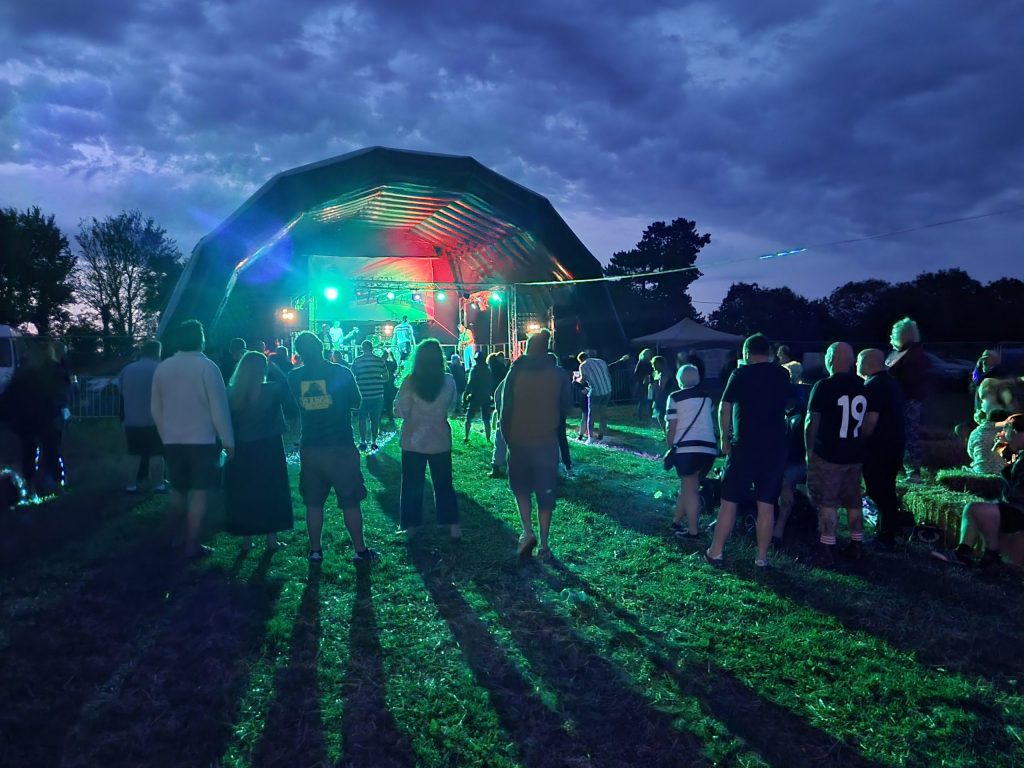
It wasn’t long before the guests started to flood into the main arena, having pitched their tents and parked their campervans in the adjacent campsite field. The resident DJ kicked off the music whilst the first band sound-checked and the event was quickly in full swing! The bands, many of whom had initially committed to perform in 2020 didn’t disappoint and were clearly excited to be on stage performing live to an audience again. With everything from ska to rock, and funk to britpop, there was something for everyone over the course of the weekend, and the performers absolutely gave it their all. The atmosphere across the whole weekend was incredible!

Lightning never strikes twice…

On Friday night, ferocious thunderstorms hit the south coast at around 2am. Expecting to see something fairly apocalyptic on Saturday morning it was testament to Lyndsey and her team that everything was intact and secure. Day Two kicked off as planned and the crowds started to arrive again, prepared for whatever adverse weather the day might through at them. Nothing was going to stop people from having a fantastic time!

I chatted with Lyndsey Rowe as the day went on and she explained to me why she so desperately wanted the event to go ahead as planned.

“Lloyd would have been 40 the day before the festival started this year. We celebrated his birthday as a team and shared some wonderful memories, and I really wanted to make this whole event into a celebration. His legacy is that other people with a brain tumour get the support that they need.”

Despite a national pandemic, acts having to isolate at the last minute, and a whole heap of added Covid-related safety measures, Legacy Festival still raised an incredible £6,872! Lloyd’s Legacy has now raised almost £40,000 for brainstrust, and we couldn’t be more grateful. A huge thank you goes out to the event organisers, the many volunteers, supporters, and of course, everyone who attended. The proceeds raised at Legacy Festival will help to fund counselling sessions for people with a brain tumour, a cause which Lloyd himself was very passionate about.

We are incredibly proud to have supported thousands of people through difficult journeys, and we couldn’t do this without the generosity and support we receive from funds like Lloyd’s Legacy.

supporting you

Introduction

The Brain Tumour Data Dashboard lets you explore up -to-date, population level data about the brain tumours diagnosed in England between 2013 and 2015. Using the drop down menus on the left you can select different groups of patients to view in the charts below. In these charts the number of patients for every 100 diagnoses is displayed as images of people. Patients have been grouped by date of diagnosis, type of tumour, age, gender, and region in England.

For each group of patients you can explore the different routes to diagnosis, the proportion of those who received chemotherapy or radiotherapy, as well as the survival of the patients within each group. For more information about what these metrics mean please see the glossary.

How to use

  1. Select the year of diagnosis using the drop down menu.
  2. Select your patient group of interest from the four drop down menus in the following order:
    1. Tumour group
    2. Age at diagnosis
    3. Region of England
    4. Gender of patient
  3. To view a second chart to compare different groups of patients, click the ‘compare’ button.The second chart will appear below the first chart.

*Note that the tool is best used on a laptop or tablet rather than a mobile phone*

Unavailable data

Some of the data in these charts is not available.There are two main reasons for this:

  1. How the data has been grouped

If you cannot select a patient group from the drop down menus, the data is unavailable because of how the data has been organised.

Public Health England has grouped the data like a branching tree. The bottom of the tree contains all the patients with brain tumours, and then each branch divides the data by a certain characteristics, like age, or location of tumour. But the data is divided in an order, starting with location of the tumour (endocrine or brain), then by age, region, and gender. Age is at the start because it makes a bigger difference to survival rates and treatment rates than gender or region. Sometimes, after the data has been split by type of tumour and age, there is not enough data to be split again. This is because to protect patient confidentiality groups cannot contain less than 100 patients. Because some groups cannot be split further, you cannot create ‘totals’ for everyone by region or gender. For example, you cannot see results for all ages by region, or all brain tumours by gender. If these totals were calculated and released, it might be possible to identify patients, which is why Public Health England cannot release this data.

  1. Statistical reasons and data availability

If you can select a patient group from the chart menus, but the chart does not display, the data is unavailable for one of several reasons:

  1. Data is not yet available for the selected year from Public Health England.
  2. Data is not available because the data quality is too poor to release this statistic.
  3. Data is not available as the statistic is not appropriate for this group.
  4. Data is not available because the standard error of the estimate was greater than 20% and so the estimate has been supressed.

Up to date brain tumour data

Brain tumour data may influence the decisions you make about your care. Data also helps you understand the bigger picture, or landscape, in which you find yourself.

Brain tumour data and statistics influence the focus, and work of organisations like brainstrust. The information helps us to understand the scale and impact of the problems we are setting out to solve.

This tool helps you understand the landscape in which you find yourself having been diagnosed with a brain tumour. This landscape can be particularly tricky to navigate as there are many different types of brain tumour, all of which have a different impact.

The information you see represents the most up-to-date, official, population level brain tumour data available for England. Over time we will be adding to the brain tumour data available and publishing reports, with recommendations, as a result of what we learn from this data.

The data behind this content has come from Public Health England’s National Cancer Registration and Analysis Service (NCRAS) and is a direct result of the ‘Get Data Out’ project.

This project provides anonymised population level brain tumour data for public use in the form of standard output tables, accessible here: http://cancerdata.nhs.uk/standardoutput

Incidence

The number or rate (per head of population) of new cases of a disease diagnosed in a given population during a specified time period (usually a calendar year). The crude rate is the total number of cases divided by the mid-year population, usually expressed per 100,000 population.

Malignant

Malignant tumours which grow by invasion into surrounding tissues and have the ability to metastasise to distant sites

Mortality

The number or rate (per head of population) of deaths in a given population during a specified time period (usually a calendar year). The crude rate is the total number of deaths divided by the mid-year population, usually expressed per 100,000 population.

Non-malignant

Not cancerousNon-malignant tumours may grow larger but do not spread to other parts of the body.

Survival

The length of time from the date of diagnosis for a disease, such as cancer, that patients diagnosed with the disease are still alive. In a clinical trial, measuring the survival is one way to see how well a new treatment works. Also called ‘overall survival’ or ‘OS’.

Routes to Diagnosis

Under the ‘Routes to Diagnosis’ tab in the Brain Tumour Data Dashboard, you can explore the ways patients have been diagnosed with brain tumours. There are many ways, or routes, for cancers to be diagnosed in the NHS. A ‘route to diagnosis’ is the series of events between a patient and the healthcare system that leads to a diagnosis of cancer. The routes include:

  1. Two Week Wait

Patients are urgently referred by their GP for suspected cancer via the Two Week Wait system and are seen by a specialist within 2 weeks where they are diagnosed.

  1. GP referral

Diagnosis via a GP referral includes routine and urgent referrals where the patient was not referred under the Two Week Wait system.

  1. Emergency Presentation

Cancers can be diagnosed via emergency situations such as via A&E, emergency GP referral, emergency transfer or emergency admission.

  1. Outpatient

Outpatient cancer diagnoses include diagnoses via an elective route which started with an outpatient appointment that is either a self-referral or consultant to consultant referral. (It does not include those under the Two Week Wait referral system).

  1. Inpatient elective

Diagnosis via an inpatient elective route is where diagnosis occurs after the patient has been admitted into secondary care from a waiting list, or where the admission is booked or planned.

  1. Death Certificate Only

Diagnoses made by Death Certificate Only are made where there is no more information about the cancer diagnosis other than the cancer related death notifications. The date of diagnosis is the same as that of the date of death.

  1. Unknown

For some patients with a cancer diagnosis, there is no relevant data available to understand the route to diagnosis.


More information

If any of the statistical terms in this section of the brainstrust website are hard to understand, we recommend looking them up here:

Cancer Research UK’s Cancer Statistics Explained

http://www.cancerresearchuk.org/health-professional/cancer-statistics/cancer-stats-explained/statistics-terminology-explained#heading-Seven

If you are looking for help understanding terms relating specifically to brain tumours, and treatment, then the brainstrust glossary is available here:

https://www.brainstrust.org.uk/advice-glossary.php