Helen joined us in Brighton as part of our first cohort of superheroes taking on the all-new Follow the Seagulls Brighton trek. But for Helen, 50 miles in 2 days didn’t seem like enough of a challenge! She set herself the challenge of walking the 50-mile route in 17 hours – starting at 5am she set out to race the sun and complete the trek before 10pm. In this article we catch up with Helen about how the trek went, and Connor, Helen’s personal trainer, who Helen credits as the person who made this fundraising challenge possible.
Helen’s story
Why I decided to take on Follow the Seagulls
 I spent the pandemic on watch and wait living with a 2.5-inch diameter meningioma nestled behind my right ear. I finally got my surgery late in 2020 but developed a secondary infection which resulted in further emergency surgery. This left me weak, overweight, unable to balance, in pain walking up a single flight of stairs and with a long recuperation period.
When I was finally given the go ahead from my neurosurgeon, I joined the gym with the sole intention of gentle swimming. However, following the necessary gym induction with personal trainer Connor, I signed up for some private conditioning sessions to help me get my health back. One milestone led to another; Connor encouraged me to keep progressing a little at a time and we made huge strides in terms of my weight and all-round functional fitness.
I signed up for Follow the Seagulls before Christmas- at that time June seemed a long way off! The challenge seemed to be the perfect way to celebrate my return to health and to help others living with a brain tumour.
In the run up to the walk, (although he denies it now) my son decided to up the challenge and suggested we walk all 50 miles in one day rather than two – and foolishly I agreed!
Walking 50 miles in 17 hours
We worked out that if we kept to a consistent 3 miles per hour pace, we would be able to complete the challenge in about 17 hours. This did not allow for any rest time, as I thought that if I sat down to rest, chances are I would never get up again! This was my first mistake as it didn’t allow for errors of course, or foot treatments!
We checked the daylight hours and 5am to 10pm seemed, on paper, to be our window (this was my second mistake, as it turned out it went dark at 9.30pm).
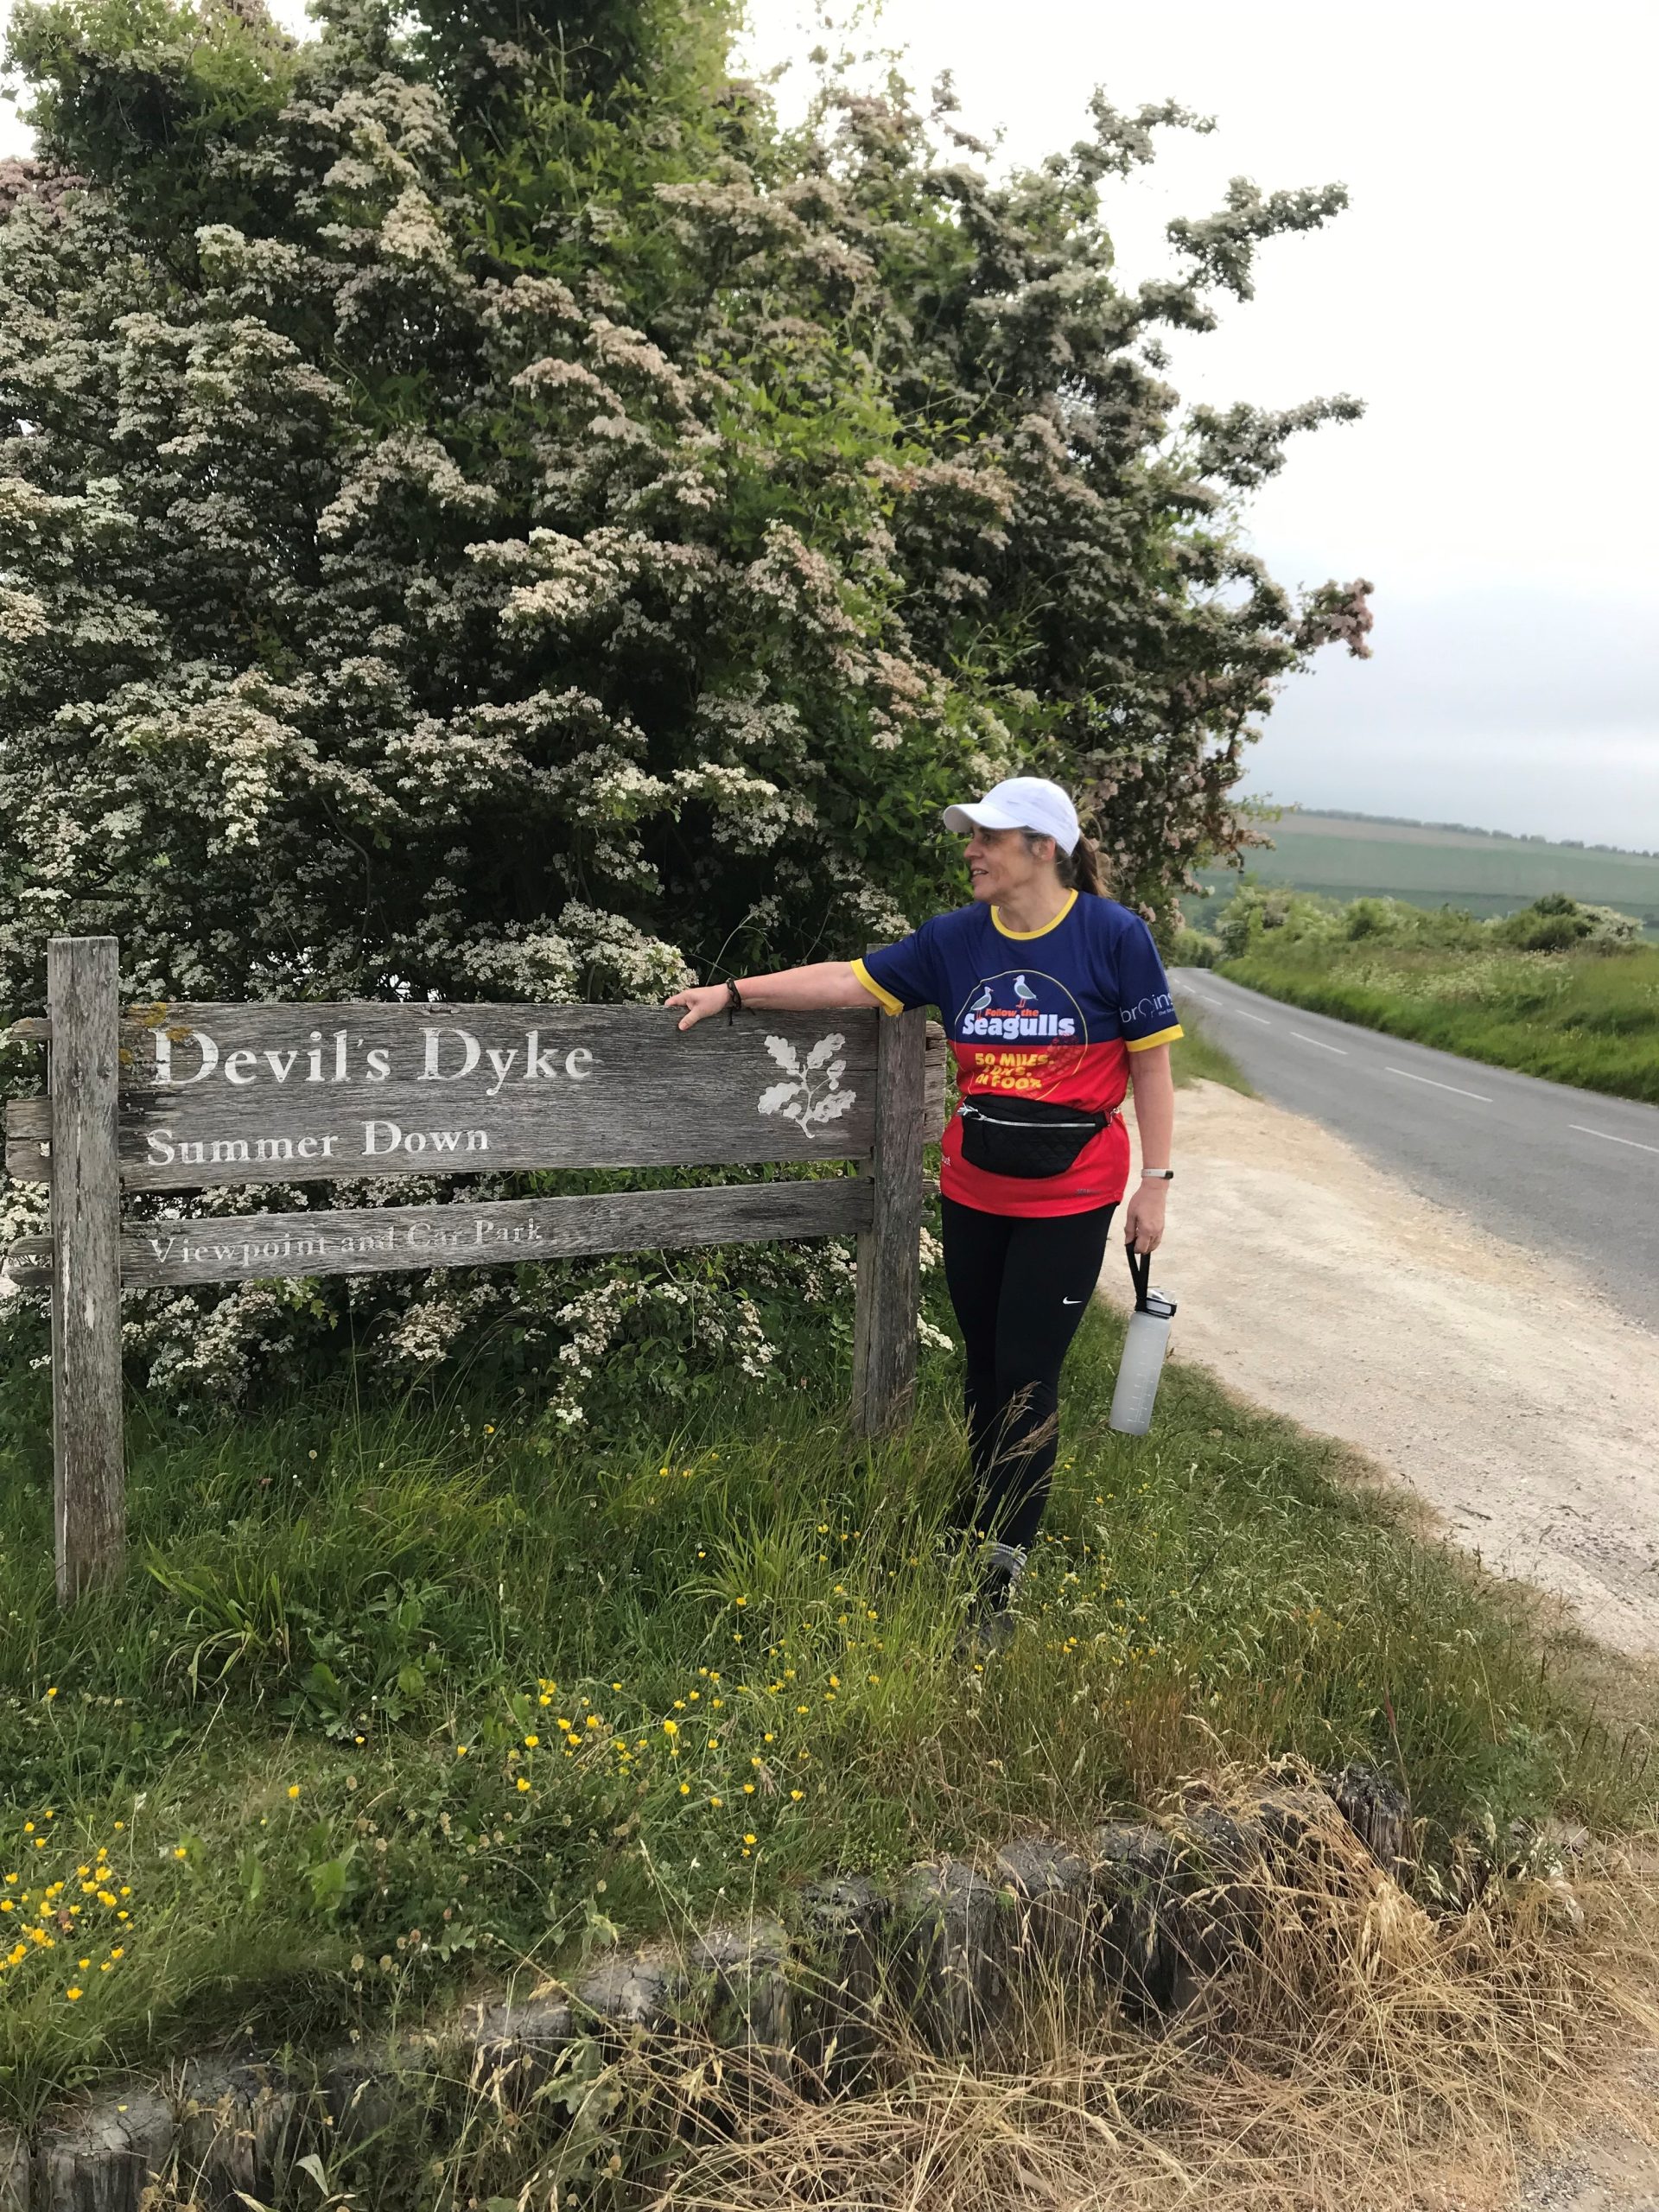
My son David and I set off promptly at 5.00am from Washington. We made the first checkpoint 15 minutes early, and then the second at Devils Dyke 10 minutes early. Given our great pace, we were feeling pretty confident as we headed on to Brighton golf club, however this is where we made a wrong turn and ended up half an hour off course. Being on the back foot and having no wriggle room in the time, we had to push hard towards the seafront and Shoreham harbour. David’s feet started to complain so we had a forced stop to allow him to strap them up.
After these delays were were behind schedule and to make up the pace we were practically running along Brighton seafront. As we hurried along a holiday maker ran up to us and thrust £10 at me for the fund.
We arrived at Brighton Palace Pier 1.30pm on the dot, after our dash along the seafront we were back on schedule as we set course for part 2 and Eastbourne!
Sadly, David’s injuries deteriorated at about 30 miles, and he was forced to pull out at the Saltdean checkpoint, which caused a dilemma as he was carrying our food and water in his backpack – a weight which I would be unable to sustain.
As time was ticking on, I grabbed the map, and a single bottle of water and marched off towards Newhaven alone while the team decided what to do next.
At the next checkpoint Connor, my PT, was there, ready with a replenished backpack to support me through the final 15 miles.
It was fitting and somewhat emotional to have Connor support me to get over the line, I would not have been able to complete it alone, and I would certainly not have been able to tackle it without his patient coaching over the last 18 months.
I remember stopping momentarily halfway up the third sister when I hit a mental wall, and Connor asked, “what is it your hamstrings or your calves?” to which I replied, “neither it’s my brain, I have forgotten how to put one foot in front of the other…”
Luckily it came back to me, and we carried on.
The sun set at about 9.00pm and it got very cold up on beachy head and then at 9.30pm it got very dark too. Fortunately, I had a head torch as there are a lot of rabbit holes on the terrain up there and I certainly didn’t want to be walking anywhere near the edge of the cliff.
A final steep descent into Eastbourne and we arrived at 9.58pm – just two minutes inside the 17-hour target.
Waiting for my next adventure
I have now achieved all the goals we set, and I am humbled by the generosity of people donating to my walk. Now I am waiting for my next adventure to make itself known to me.
Connor’s story
Meeting Helen
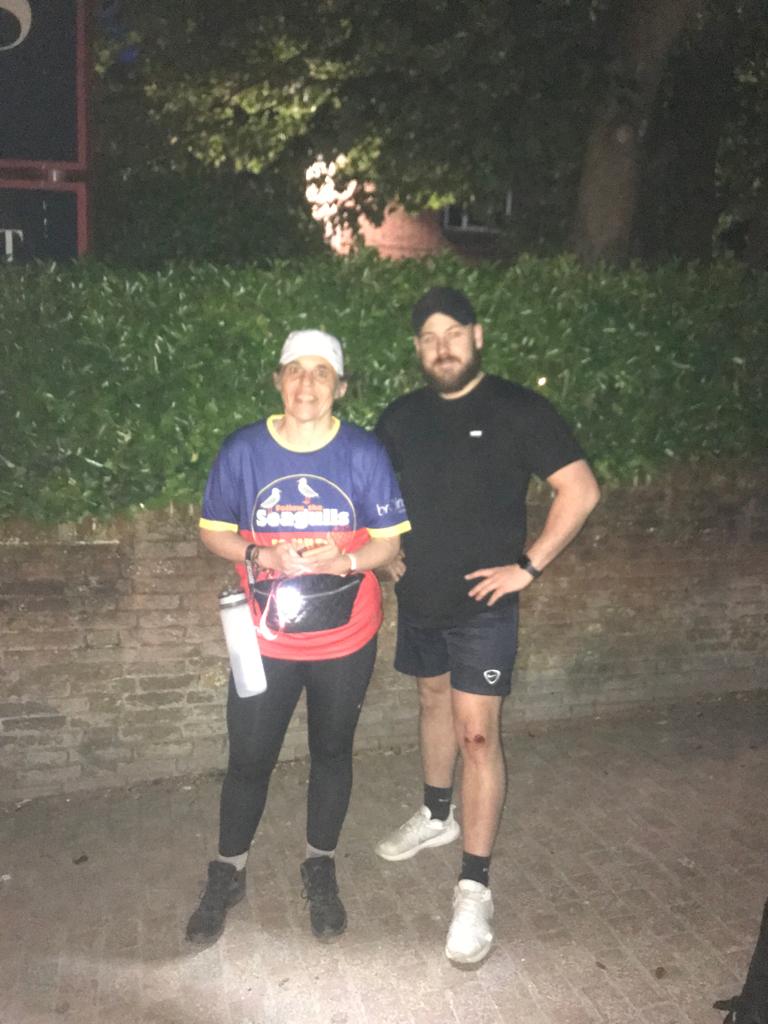
Helen and Connor at the finish line!
My journey began in October 2021. As a newly qualified Personal Trainer, Helen was one of my first clients. The physical barriers and limitations she brought to me at the start were challenging and somewhat nerve-racking.
Helen was recovering from brain tumour surgery and was 16 stone plus. She had next to no balance nor strength in her body. So, we started our journey steadily; increasing the intensity and volume slowly throughout the weeks.
As we built up the training plan each Short-, Medium- and Long-term fitness goal that we set we smashed!
Helen now sits at 11 Stone, throwing weights around the gym for fun, smashing the 50-mile trek and leaving her Personal Trainer in the wind with her 9 minute per kilometre hiking speed!
Helen’s journey has been remarkable and to accomplish all of this with the adversity she has been through, is something I am very proud of. I can’t wait for what challenge she has planned next!
Taking on the trek
I joined Helen in Newhaven to support the final stages of her hike. I awkwardly fell on my knee 20 minutes in but wasn’t going to allow this to disrupt the hike or my support for Helen.
We paced it through Newhaven then hitting Seaford’s Beach. The journey into Cuckmere was a frustrating one, knowing we’d come back on ourselves, but this gave us time to brace ourselves for the big 7 sisters.
As we began to climb, my pace naturally dropped…. Helen’s pace didn’t! In this moment, I began to see Helen’s disciplined mindset and ability, really come to life.
As we marched towards Eastbourne, the darkness drew in, but we weren’t going to stop! I was counting each step towards Bedes School, the steepest hill you can ever imagine! I found this the hardest, as every lower body muscle ached! But as we stepped down from the last step, I realised we had made it!
It’s great seeing clients progress through data and numbers, but to see Helen push through barriers and her limitations is the highlight of my career. I look forward, to seeing what’s next for Helen.
Helen’s inspirational story and incredible effort in completing the 50 mile trek in 17 hours has left all of us here at brainstrust utterly humbled. It’s the passion of people like Helen that fuels our mission and ensures we are able to continue our transformative work supporting people affected by a brain tumour. So far, Helen has raised £780 for brainstrust – we would like to say a huge thank you to Helen for taking on this challenge, to her son and Connor for supporting her on her walk and to everyone who donated for helping fund our vital work.
If you want to find out more about our upcoming Follow the Seagulls hikes, click here. If hiking’s not your thing, there’s plenty more fundraising inspiration to be on our do your own thing fundraising page.
Here’s Helen powering up the Seven Sister at an amazing pace…