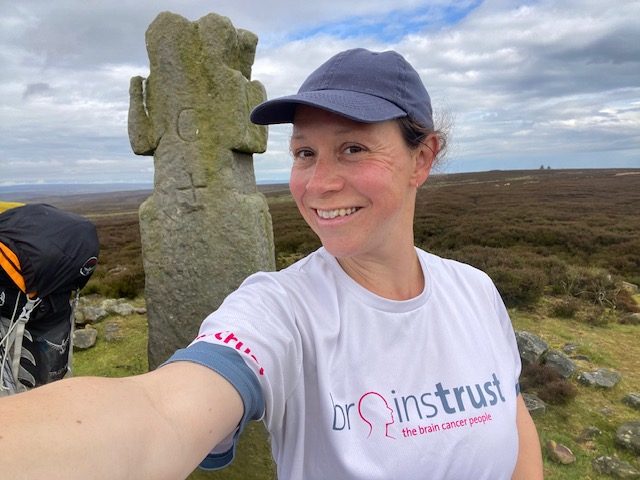
 In a heartfelt tribute to her late father, Hannah Mayne embarked on a remarkable journey, walking 40 miles across the rugged terrain of the Lyke Wake Walk in North Yorkshire. This challenging endeavor holds a special significance for Hannah as she undertakes it in her 40th year, honoring the memory of the man who inspired her strength and perseverance. The Lyke Wake Walk, a storied path known for its beauty and difficulty, served as the backdrop for Hannah’s personal pilgrimage, a testament to her enduring love and dedication to her father’s memory.
Read Hannah’s story below:
In the year of my 40th birthday, I decided to take on a challenge that would make even the hardiest of souls reconsider their life choices: crossing the North Yorkshire Moors. Following in the legendary footsteps of my dad, who strode these same paths 35 years ago in a mere 20 hours, I set out to prove that the apple doesn’t fall far from the tree. I imagine he’d be proud, though perhaps slightly put out that I dared to challenge his record. He lost all his toenails afterwards! I can report no toenail loss and no blisters. #smug
Pablo and I booked a 2-night stay at the Cleveland Tontine boutique hotel and received exceptional care from Marie and her team. We were warmly welcomed and shown a beautiful superior bedroom. Thanks to my careful planning, the room featured a stunning freestanding bath with Temple Spa products, perfect for unwinding before and after my walk. When I informed Marie about our early arrival the next night, she kindly offered us access to the bar on an honesty-based system, which reminded me that there are still wonderful and trusting people in this world. If you’re reading this and seeking accommodation near the endpoint of the E – W reverse crossing, I wholeheartedly recommend the Cleveland Tontine.
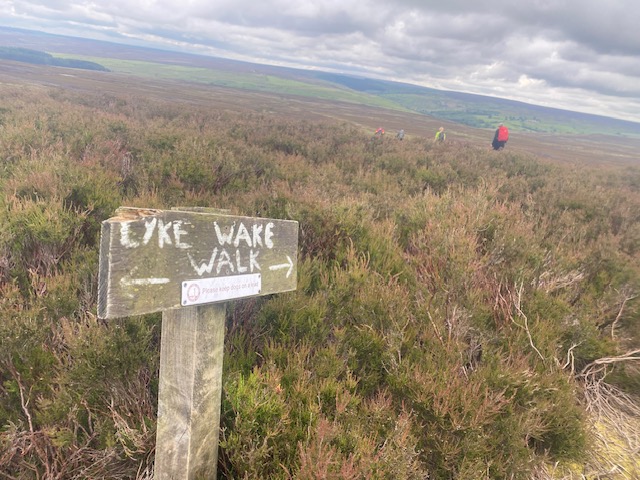
At some ungodly hour, deep in what can only be described as the hour of the dead, our alarm rudely woke us at 3:30 AM. I’m convinced there’s nothing to do at this time except sleep or be dead. But no, for some inexplicable reason, this was the start time for my 40-mile walk. Fondly known as the Lyke Wake or Walk of the Dead. The coffin walk, okay? After a couple of Nespressos, our journey began at 4:45 AM with a drive over to Ravenscar, where the promise of coastal views and the ominous expanse of the moors lay ahead. The plan: walk 40 miles from east – west, ending in Osmotherley. Simple, right? Well, not quite.
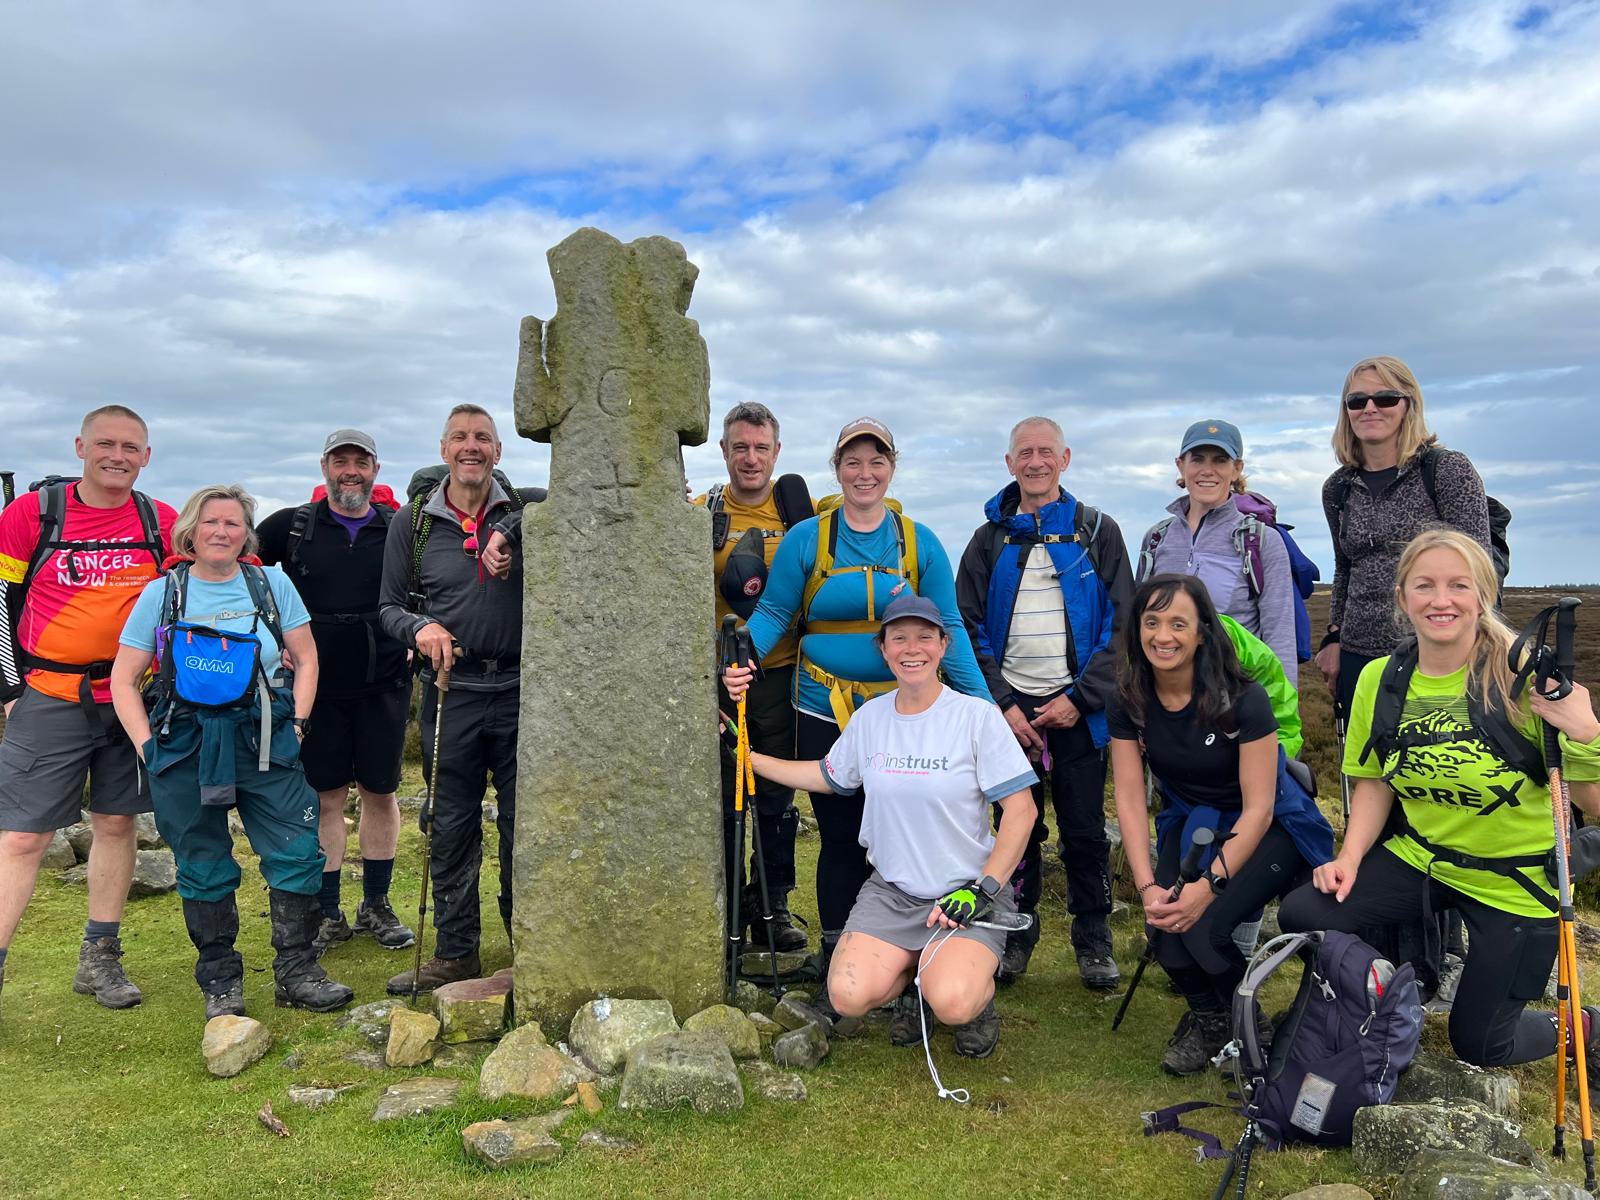
Accompanying me on this foolhardy adventure were 12 other determined souls, beautifully guided by the dynamic duo, Kathy and Den Johnson. Kathy’s energy and enthusiasm were matched by her grit and sense of direction, while Den’s understanding that he needed to be at the checkpoints or he would likely be in a coffin to be carried off across the moors, never to be seen again! Remember it was the walk of the dead after all!!
Then there was Pablo and Erin the dog (ETD), my mobile pit stop and full-on motivation manager. If there was ever a cheerleader in human form, Pablo is it. Armed with dry socks, snacks, water, and an endless supply of encouragement, he kept my spirits high and my legs moving. He just knew I would need a full set of dry clothes, a warm cup of tea, and a replenishment of snacks! All made in advance, of course.
The Moors had other ideas. They threw everything at us: mud that could swallow a boot whole, bog that consumed people and walking poles, hills that laughed in the face of gravity, and winds that could strip the feathers off a grouse. But we trudged on, supported by the knowledge that every step brought us closer to our goal and the funds raised for brainstrust, a charity close to our family’s hearts.
The first few miles from Ravenscar to Ellabeck, crossing Jugger Howe Moor, felt like a rain-stained breeze, with stunning views and the soothing sounds of nature lulling us into a false sense of security. But as the hours dragged on, the challenge revealed its true nature. The relentless walking started to take its toll; my back, neck, and shoulders ached, and my legs were shredded by low-lying bracken and gorse. I had chosen to wear a skort (skirt/shorts) because I preferred bare legs to the ‘boil-in-a bag’ feeling of waterproof leggings, as Kathy cleverly described them. By the end of the bog section, I was soaked right down to my underwear! My Solomon GX4D boots, which had been fantastic until then, had let my feet and socks get completely saturated. Despite the excellent combination of Injinji Liner Crew Toesocks and Merino Danish Endurance socks, the saturated peat bog and relentless rain overpowered them.
We continued across Wheeldale Beck and its stepping stones, then under Wheeldale Plantation to meet the Blue Man-i-th-Moss, a boundary stone believed to have been placed in Roman times. Over 2 meters tall and surrounded by other boulders and stones, it has been repainted with a blue stick man. Rosedale Moor is incredibly boggy!! 3 people fell in and one walking pole will never see the light of day again.
We followed the road past the Fat Betty Cross (White Cross) and approached checkpoint 2 at Rosedale Head and Young Ralph’s Cross, I was thrilled to see my motivation manager and mobile pit stop. Every wet layer came off and went straight into a wet bag, and I changed into a full set of dry clothes and boots. Even my trusty brainstrust fundraising t-shirt was replaced with a fresh, dry one.
After this we followed the road onto Farndale Moor and then Round Hill, before following the Cleveland Way to reach checkpoint 3 at Claybank. From there, we continued past Lordstones, descended off Carlton Moor, and managed the last ascent followed by a very slippery descent through Clain Wood, Scarth Wood Moor, and finally reached the endpoint and Lyke Wake marker at Cod Beck Reservoir Car Park.
It took us 17 hours 30 mins, was just under 40 miles, ascent 5156 feet, descent 5449 and roughly 86076 steps. As day turned to night, the moors transformed into a mysterious and somewhat spooky landscape. The shadows played tricks on our minds, and classically the batteries in my head torch decided their time was up, they could go no further. This resulted in a very wet fumble to find and install 3 new AAA batteries. Thank goodness I had added batteries to the provision list the day before.
Despite the trials and tribulations, our camaraderie and determination saw us through. Each short pit stop, expertly managed by Pablo, felt like a mini celebration. There were different conversations to be had with each member of the team and endless banter kept the mood light, even when our legs felt like lead and my shoulders and upper back were screaming at me.
Finally, after an eternity, we finally reached the finish line in Osmotherley. Exhausted but elated, we collapsed in a heap of mud-splattered joy. We had done it. 40 miles of the North Yorkshire Moors conquered, and all for a fantastic cause. So here’s to my 40th year, a 40-mile trek, and the incredible team that made it possible. Dad, I hope I’ve done you proud, even if I did finish a bit quicker than you. And to everyone who supported us, thank you from the bottom of our tired feet. Now, where’s that pint?
Thank you to everyone who sent online and offline donations! I have raised £2,197.76 for brainstrust!!!