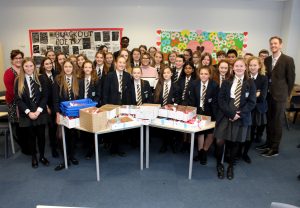
In Fundraising News, Uncategorized

Greensward Academy

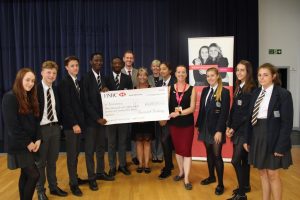
This week, we were honoured to join Sharon as we received a heartfelt donation from the staff and pupils at Greensward Academy in Essex. Over the past academic year, the school has raised an incredible £4,038.29 in support of brainstrust! Their continuous support and passionate fundraising efforts showcase their tremendous community spirit, which is something to be very proud of. We would like to thank all the staff, pupils, parents and the surrounding community who have contributed towards this fantastic achievement; making an incredible difference within the brain tumour community. 

Take a look at Sharon’s story to find out more. 


Sharon’s Story

How it all began

It was during the organisation of a fundraising event for brainstrust last year that I was approached by the Head of Year 9 at our local school; The Greensward Academy in Hockley (Essex) to suggest a partnership between myself, as a member of the community living with a brain tumour, and the Leadership teams at the school. All with view to working together to raise funds for their chosen charity for the coming school year. This then led them to choose brainstrust, as it was clearly something close to my heart but also resonated with the school. Sadly, a couple of students had lost a parent to this devastating illness over recent years, meanwhile, two students currently at the Academy are living with a brain tumour. So, a fantastic partnership was born.

There seems to be a good number of people in Hockley alone that are living with this diagnosis. Some of those people have a higher grade tumour, and that pushed me even more to raise awareness of this disease. I also wanted to share how parents can spot vital signs and symptoms, which can reduce the effects if caught quickly enough. Early intervention can help to save lives.

A year of fundraising

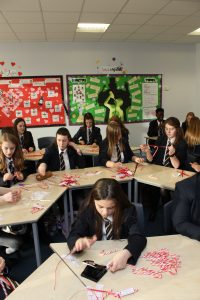
I was honoured to be invited to meet with the students in the Leadership Teams, and see for myself the infectious energy and enthusiasm of Mr McAllen, the Head of Year 9. I got involved with their working parties; I assisted with their distribution and quality control of “Candy Canes” at Christmas; Chocolate Easter Eggs with a golden ticket up for grabs at Easter; “Take a Break” KitKats with the all-important hidden ‘£25 ticket’ for the final Summer Term before ‘breaking up’ for the end of the School Year!! All of this, alongside “Non-Uniform Days” each term, resulted in an incredible final total of £4,038.29 for brainstrust!

The school also used this opportunity to show the students a PowerPoint presentation from brainstrust at one of their assemblies to explain who and what brainstrust stands for as a relatively small brain tumour charity. This was used as a tool for raising awareness of this devastating illness, and the effects it has on peoples lives, whether they be living with a brain tumour, have lost someone dear or are currently caring for someone with a brain tumour. It also went so far as to show the students how the money they raise would be spent, and how these funds would continue to help support the ongoing workshops, resources, Meetups, the Brainbox’s. Not to mention, supporting ‘Little brainstrust’ which is solely for children and teenagers that are currently receiving treatment for and/or living with a brain tumour; support for those young people, and for their families too.

Infectious community spirit

I for one would love it if other schools locally to me, and further afield too, could get behind this charity to help to highlight the incredible work that they do, but to also raise awareness amongst parents and students alike.

I feel very proud of the staff and students getting behind a fantastic charity with such determination and enthusiasm, it really was heart-warming. To see all the additional work that is put in by staff and students alike with such fun and passion, it was something I feel very honoured to have been a part of. I had so much fun!

A big shout out to all the staff & students of Greensward Academy, and the people of Hockley, for showing such kindness and generosity. You never fail to make me feel very humbled to part of this community.


uk paediatric symposium 2019 logo multi 6brain tumour data graphic on white

Introduction

The Brain Tumour Data Dashboard lets you explore up -to-date, population level data about the brain tumours diagnosed in England between 2013 and 2015. Using the drop down menus on the left you can select different groups of patients to view in the charts below. In these charts the number of patients for every 100 diagnoses is displayed as images of people. Patients have been grouped by date of diagnosis, type of tumour, age, gender, and region in England.

For each group of patients you can explore the different routes to diagnosis, the proportion of those who received chemotherapy or radiotherapy, as well as the survival of the patients within each group. For more information about what these metrics mean please see the glossary.

How to use

  1. Select the year of diagnosis using the drop down menu.
  2. Select your patient group of interest from the four drop down menus in the following order:
    1. Tumour group
    2. Age at diagnosis
    3. Region of England
    4. Gender of patient
  3. To view a second chart to compare different groups of patients, click the ‘compare’ button.The second chart will appear below the first chart.

*Note that the tool is best used on a laptop or tablet rather than a mobile phone*

Unavailable data

Some of the data in these charts is not available.There are two main reasons for this:

  1. How the data has been grouped

If you cannot select a patient group from the drop down menus, the data is unavailable because of how the data has been organised.

Public Health England has grouped the data like a branching tree. The bottom of the tree contains all the patients with brain tumours, and then each branch divides the data by a certain characteristics, like age, or location of tumour. But the data is divided in an order, starting with location of the tumour (endocrine or brain), then by age, region, and gender. Age is at the start because it makes a bigger difference to survival rates and treatment rates than gender or region. Sometimes, after the data has been split by type of tumour and age, there is not enough data to be split again. This is because to protect patient confidentiality groups cannot contain less than 100 patients. Because some groups cannot be split further, you cannot create ‘totals’ for everyone by region or gender. For example, you cannot see results for all ages by region, or all brain tumours by gender. If these totals were calculated and released, it might be possible to identify patients, which is why Public Health England cannot release this data.

  1. Statistical reasons and data availability

If you can select a patient group from the chart menus, but the chart does not display, the data is unavailable for one of several reasons:

  1. Data is not yet available for the selected year from Public Health England.
  2. Data is not available because the data quality is too poor to release this statistic.
  3. Data is not available as the statistic is not appropriate for this group.
  4. Data is not available because the standard error of the estimate was greater than 20% and so the estimate has been supressed.

Up to date brain tumour data

Brain tumour data may influence the decisions you make about your care. Data also helps you understand the bigger picture, or landscape, in which you find yourself.

Brain tumour data and statistics influence the focus, and work of organisations like brainstrust. The information helps us to understand the scale and impact of the problems we are setting out to solve.

This tool helps you understand the landscape in which you find yourself having been diagnosed with a brain tumour. This landscape can be particularly tricky to navigate as there are many different types of brain tumour, all of which have a different impact.

The information you see represents the most up-to-date, official, population level brain tumour data available for England. Over time we will be adding to the brain tumour data available and publishing reports, with recommendations, as a result of what we learn from this data.

The data behind this content has come from Public Health England’s National Cancer Registration and Analysis Service (NCRAS) and is a direct result of the ‘Get Data Out’ project.

This project provides anonymised population level brain tumour data for public use in the form of standard output tables, accessible here: http://cancerdata.nhs.uk/standardoutput

Incidence

The number or rate (per head of population) of new cases of a disease diagnosed in a given population during a specified time period (usually a calendar year). The crude rate is the total number of cases divided by the mid-year population, usually expressed per 100,000 population.

Malignant

Malignant tumours which grow by invasion into surrounding tissues and have the ability to metastasise to distant sites

Mortality

The number or rate (per head of population) of deaths in a given population during a specified time period (usually a calendar year). The crude rate is the total number of deaths divided by the mid-year population, usually expressed per 100,000 population.

Non-malignant

Not cancerousNon-malignant tumours may grow larger but do not spread to other parts of the body.

Survival

The length of time from the date of diagnosis for a disease, such as cancer, that patients diagnosed with the disease are still alive. In a clinical trial, measuring the survival is one way to see how well a new treatment works. Also called ‘overall survival’ or ‘OS’.

Routes to Diagnosis

Under the ‘Routes to Diagnosis’ tab in the Brain Tumour Data Dashboard, you can explore the ways patients have been diagnosed with brain tumours. There are many ways, or routes, for cancers to be diagnosed in the NHS. A ‘route to diagnosis’ is the series of events between a patient and the healthcare system that leads to a diagnosis of cancer. The routes include:

  1. Two Week Wait

Patients are urgently referred by their GP for suspected cancer via the Two Week Wait system and are seen by a specialist within 2 weeks where they are diagnosed.

  1. GP referral

Diagnosis via a GP referral includes routine and urgent referrals where the patient was not referred under the Two Week Wait system.

  1. Emergency Presentation

Cancers can be diagnosed via emergency situations such as via A&E, emergency GP referral, emergency transfer or emergency admission.

  1. Outpatient

Outpatient cancer diagnoses include diagnoses via an elective route which started with an outpatient appointment that is either a self-referral or consultant to consultant referral. (It does not include those under the Two Week Wait referral system).

  1. Inpatient elective

Diagnosis via an inpatient elective route is where diagnosis occurs after the patient has been admitted into secondary care from a waiting list, or where the admission is booked or planned.

  1. Death Certificate Only

Diagnoses made by Death Certificate Only are made where there is no more information about the cancer diagnosis other than the cancer related death notifications. The date of diagnosis is the same as that of the date of death.

  1. Unknown

For some patients with a cancer diagnosis, there is no relevant data available to understand the route to diagnosis.


More information

If any of the statistical terms in this section of the brainstrust website are hard to understand, we recommend looking them up here:

Cancer Research UK’s Cancer Statistics Explained

http://www.cancerresearchuk.org/health-professional/cancer-statistics/cancer-stats-explained/statistics-terminology-explained#heading-Seven

If you are looking for help understanding terms relating specifically to brain tumours, and treatment, then the brainstrust glossary is available here:

https://www.brainstrust.org.uk/advice-glossary.php