In Campaign News, Fundraising, Fundraising News, little brainstrust

Greg’s 365 challenge for #TeamSeth

Greg Kirkpatrick is over a hundred days into a 365-day wild-swimming challenge, all in memory of a little boy called Seth, who died of a brain tumour aged 7 earlier this year.

He’s raising funds for brainstrust following their support of Seth’s family throughout his illness – as well as the 365 legacy fund.

Find out more about #TeamSeth here.

 Going gold

Greg’s not been shy of ideas to help him reach his remarkable fundraising target of £3,650, and he was blown away by the success of his most recent idea, which was inspired by Childhood Cancer Awareness Month this September.

On the 2nd September he wrote on his Instagram:

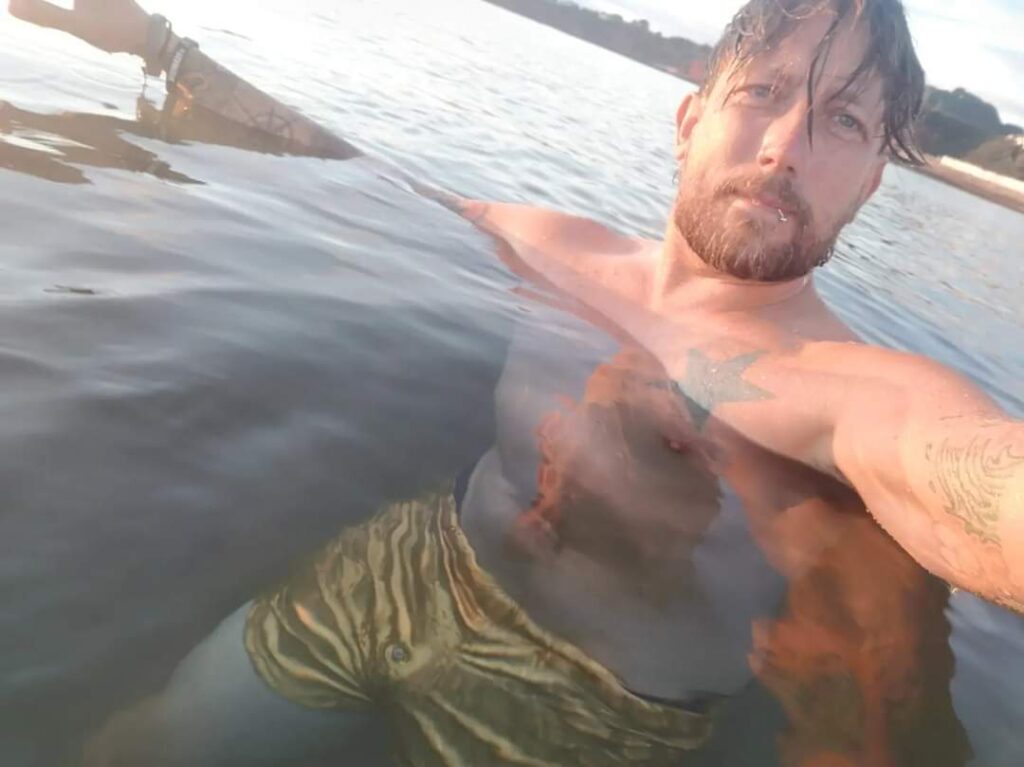
“I’ve done a skinny dip as a donation push…. How about horrendous gold shorts!?

This month is “go gold” for childhood cancer awareness…. If the donations reach £2,000 by the end of this month, I will fully degrade myself in public and do a swim in them…. In fact on the day it reaches £2k I will do the rest of the month’s daily swims in them!!”

On the 120th day of his challenge, less than 2 weeks after he posted about the shorts, Greg’s supporters got him over the £2,000 mark. He said on his Instagram post as he braved the beach in the shiny hotpants: “Absolutely overwhelmed, also pissed off I’ve gotta swim for 16 days in those horrendous gold hotpants but well done everyone and thankyou sooooo much.”

Wild swimming in Devon

Seth passed away in May 2021, and he has inspired many people to take on challenges in his honour. Greg says: “He was a fighter and an amazing little human. Inspired by Seth, I’m now taking on another challenge of wild swimming for 365 consecutive days. No wet-suit, all weathers and conditions.”

And he’s certainly experienced all weathers so far! He’s also come up against jellyfish, but nothing will stop him from completing this challenge.

“Living in Torbay, Devon I am lucky enough to be surrounded by an amazing coast and beaches, through this challenge I’ve swam and been to places I hadn’t explored before, the 365 challenge was also started locally in Brixham so everything just fell into place to take on this challenge. Seth also had a love of the beach, sea and pirates so after he passed I just had an overwhelming urge to take this on for him, even in the depths of winter going for a swim will be nothing compared to what Seth and his family went through during his treatment and I hope through this year long challenge I can raise funds and awareness for brainstrust, along with local community projects backed by the 365 legacy fund.”

You can follow Greg’s challenge on Instagram @greg365challenge, where he post daily updates and videos. As winter looms closer, he’ll need your encouragement and motivation more than ever, so do leave him a comment if you’re impressed by his dedication.

little brainstrust

Greg’s incredible fundraising will support little brainstrust, our dedicated arm for children and families affected by a devastating brain tumour diagnosis. Our little brainstrust website is a hub of information and resources to help families cope – click here to find out more.

Introduction

The Brain Tumour Data Dashboard lets you explore up -to-date, population level data about the brain tumours diagnosed in England between 2013 and 2015. Using the drop down menus on the left you can select different groups of patients to view in the charts below. In these charts the number of patients for every 100 diagnoses is displayed as images of people. Patients have been grouped by date of diagnosis, type of tumour, age, gender, and region in England.

For each group of patients you can explore the different routes to diagnosis, the proportion of those who received chemotherapy or radiotherapy, as well as the survival of the patients within each group. For more information about what these metrics mean please see the glossary.

How to use

  1. Select the year of diagnosis using the drop down menu.
  2. Select your patient group of interest from the four drop down menus in the following order:
    1. Tumour group
    2. Age at diagnosis
    3. Region of England
    4. Gender of patient
  3. To view a second chart to compare different groups of patients, click the ‘compare’ button.The second chart will appear below the first chart.

*Note that the tool is best used on a laptop or tablet rather than a mobile phone*

Unavailable data

Some of the data in these charts is not available.There are two main reasons for this:

  1. How the data has been grouped

If you cannot select a patient group from the drop down menus, the data is unavailable because of how the data has been organised.

Public Health England has grouped the data like a branching tree. The bottom of the tree contains all the patients with brain tumours, and then each branch divides the data by a certain characteristics, like age, or location of tumour. But the data is divided in an order, starting with location of the tumour (endocrine or brain), then by age, region, and gender. Age is at the start because it makes a bigger difference to survival rates and treatment rates than gender or region. Sometimes, after the data has been split by type of tumour and age, there is not enough data to be split again. This is because to protect patient confidentiality groups cannot contain less than 100 patients. Because some groups cannot be split further, you cannot create ‘totals’ for everyone by region or gender. For example, you cannot see results for all ages by region, or all brain tumours by gender. If these totals were calculated and released, it might be possible to identify patients, which is why Public Health England cannot release this data.

  1. Statistical reasons and data availability

If you can select a patient group from the chart menus, but the chart does not display, the data is unavailable for one of several reasons:

  1. Data is not yet available for the selected year from Public Health England.
  2. Data is not available because the data quality is too poor to release this statistic.
  3. Data is not available as the statistic is not appropriate for this group.
  4. Data is not available because the standard error of the estimate was greater than 20% and so the estimate has been supressed.

Up to date brain tumour data

Brain tumour data may influence the decisions you make about your care. Data also helps you understand the bigger picture, or landscape, in which you find yourself.

Brain tumour data and statistics influence the focus, and work of organisations like brainstrust. The information helps us to understand the scale and impact of the problems we are setting out to solve.

This tool helps you understand the landscape in which you find yourself having been diagnosed with a brain tumour. This landscape can be particularly tricky to navigate as there are many different types of brain tumour, all of which have a different impact.

The information you see represents the most up-to-date, official, population level brain tumour data available for England. Over time we will be adding to the brain tumour data available and publishing reports, with recommendations, as a result of what we learn from this data.

The data behind this content has come from Public Health England’s National Cancer Registration and Analysis Service (NCRAS) and is a direct result of the ‘Get Data Out’ project.

This project provides anonymised population level brain tumour data for public use in the form of standard output tables, accessible here: http://cancerdata.nhs.uk/standardoutput

Incidence

The number or rate (per head of population) of new cases of a disease diagnosed in a given population during a specified time period (usually a calendar year). The crude rate is the total number of cases divided by the mid-year population, usually expressed per 100,000 population.

Malignant

Malignant tumours which grow by invasion into surrounding tissues and have the ability to metastasise to distant sites

Mortality

The number or rate (per head of population) of deaths in a given population during a specified time period (usually a calendar year). The crude rate is the total number of deaths divided by the mid-year population, usually expressed per 100,000 population.

Non-malignant

Not cancerousNon-malignant tumours may grow larger but do not spread to other parts of the body.

Survival

The length of time from the date of diagnosis for a disease, such as cancer, that patients diagnosed with the disease are still alive. In a clinical trial, measuring the survival is one way to see how well a new treatment works. Also called ‘overall survival’ or ‘OS’.

Routes to Diagnosis

Under the ‘Routes to Diagnosis’ tab in the Brain Tumour Data Dashboard, you can explore the ways patients have been diagnosed with brain tumours. There are many ways, or routes, for cancers to be diagnosed in the NHS. A ‘route to diagnosis’ is the series of events between a patient and the healthcare system that leads to a diagnosis of cancer. The routes include:

  1. Two Week Wait

Patients are urgently referred by their GP for suspected cancer via the Two Week Wait system and are seen by a specialist within 2 weeks where they are diagnosed.

  1. GP referral

Diagnosis via a GP referral includes routine and urgent referrals where the patient was not referred under the Two Week Wait system.

  1. Emergency Presentation

Cancers can be diagnosed via emergency situations such as via A&E, emergency GP referral, emergency transfer or emergency admission.

  1. Outpatient

Outpatient cancer diagnoses include diagnoses via an elective route which started with an outpatient appointment that is either a self-referral or consultant to consultant referral. (It does not include those under the Two Week Wait referral system).

  1. Inpatient elective

Diagnosis via an inpatient elective route is where diagnosis occurs after the patient has been admitted into secondary care from a waiting list, or where the admission is booked or planned.

  1. Death Certificate Only

Diagnoses made by Death Certificate Only are made where there is no more information about the cancer diagnosis other than the cancer related death notifications. The date of diagnosis is the same as that of the date of death.

  1. Unknown

For some patients with a cancer diagnosis, there is no relevant data available to understand the route to diagnosis.


More information

If any of the statistical terms in this section of the brainstrust website are hard to understand, we recommend looking them up here:

Cancer Research UK’s Cancer Statistics Explained

http://www.cancerresearchuk.org/health-professional/cancer-statistics/cancer-stats-explained/statistics-terminology-explained#heading-Seven

If you are looking for help understanding terms relating specifically to brain tumours, and treatment, then the brainstrust glossary is available here:

https://www.brainstrust.org.uk/advice-glossary.php