brainstrust patient and carer events
Our Thrive with brainstrust events will help you live better with a brain tumour. Below you can find information about upcoming webinars and meetups, both online and face-to-face. Filter by Patient and Carer events to see what’s happening this month. If you have any questions about our supportive events or would like to book a coaching session, please email hello@brainstrust.org.uk
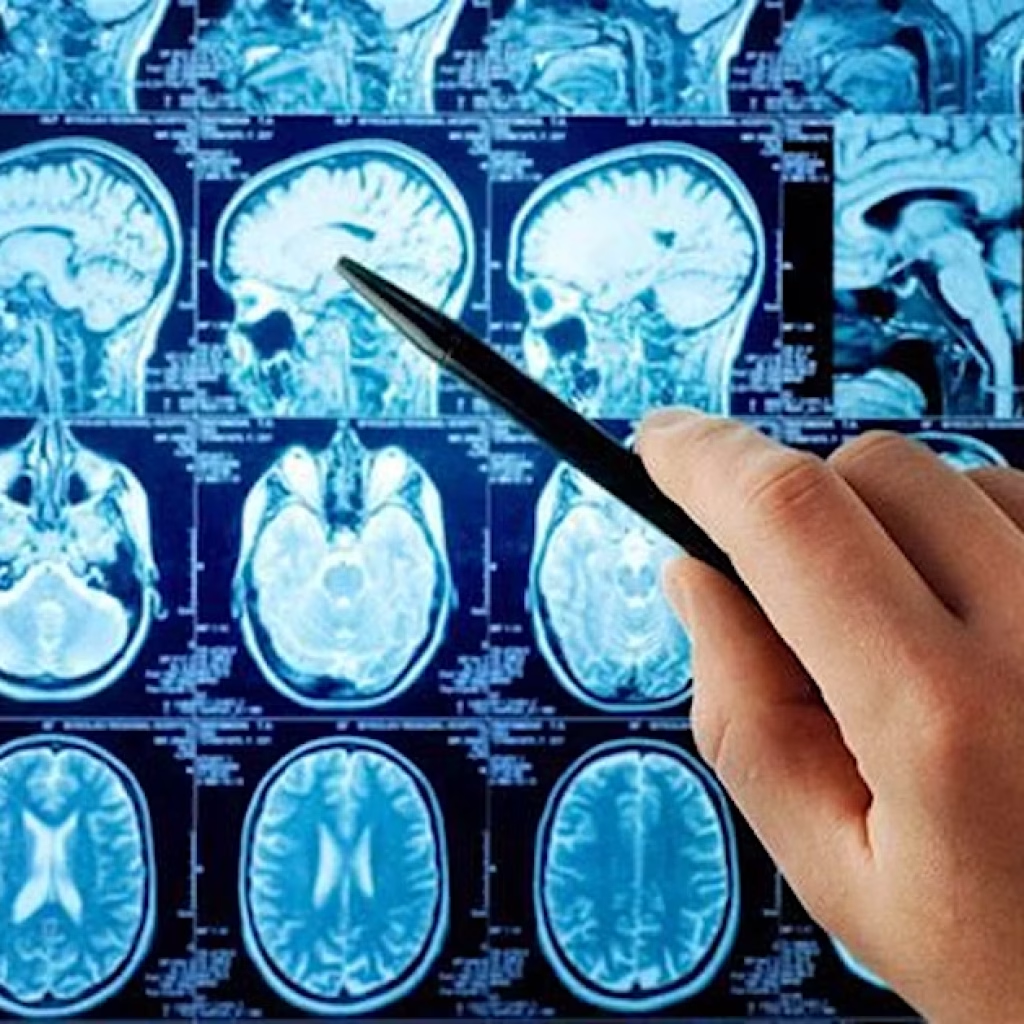
Exploring New Drug Targets in High Grade Glioma – Online Focus Group July 10th 2.00pm
Dr Phoebe McCrorie is exploring a novel approach for identifying drug targets in high grade glioma. She is using a compound called 5-ALA, which causes malignant glioma cells to fluoresce under specific lighting conditions. This helps distinguish tumour cells from healthy brain tissue and allows her to identify proteins that are uniquely present in cancer […]
Living with a low grade glioma – 10th July 16.00
Living with a low grade glioma brain tumour brings about its own challenges. Not only do you have to live with the symptoms that these tumours can bring (epilepsy has a high prevalence rate) but also the uncertain trajectory of a low grade glioma. By low grade we mean grade 2 tumours, and those that are […]
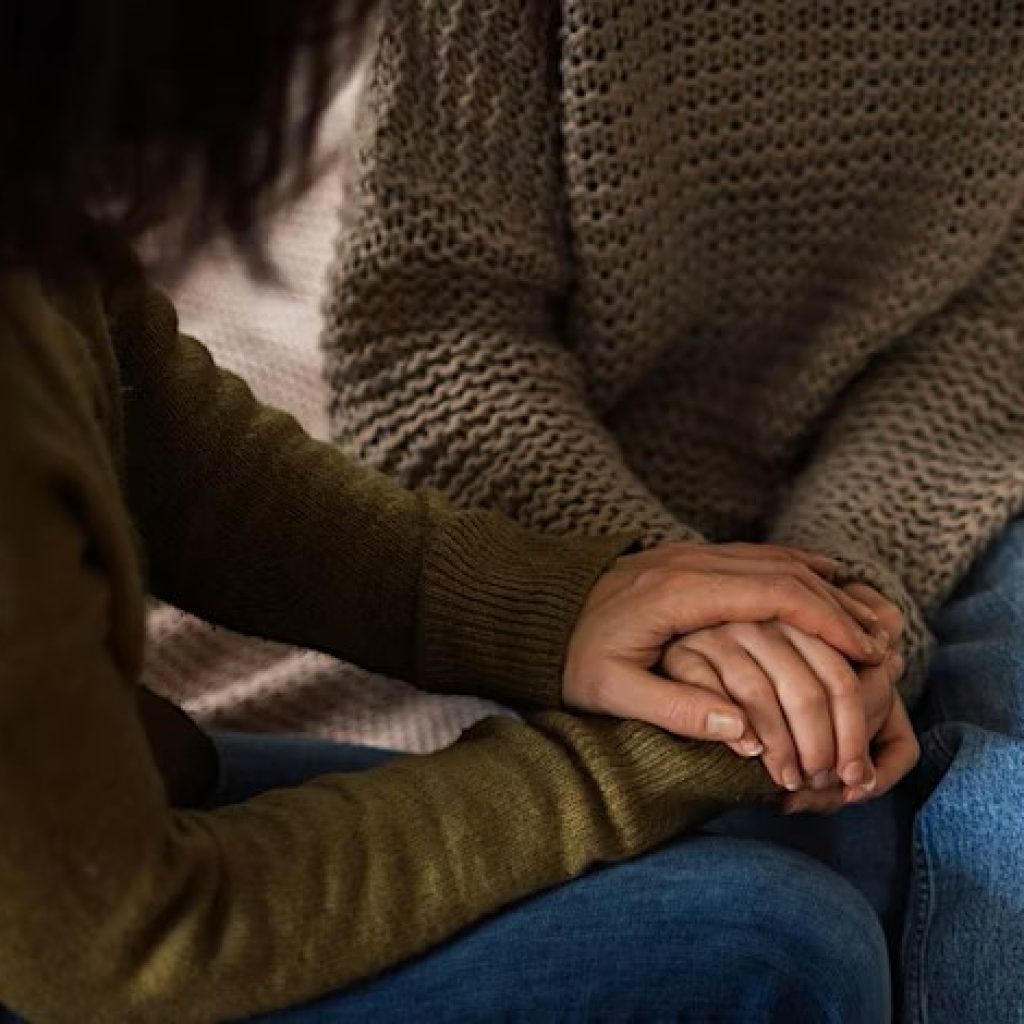
brainstrust bereavement community – Weds 16th July 7.00pm
We know that a death caused by a brain tumour is different. The uniqueness and changes that come from dying of brain tumour mean that bereavement begins before the point of death. Whilst it is normal to mourn these changes, expressing this loss can be difficult while their loved one is living, and people often […]

Living with metastatic brain cancer? – Thurs 17th July 2.00pm
Living with metastatic brain cancer? Welcome to our online event where we come together to share stories, offer support, and provide resources for those living with metastatic brain cancer. Join us for informative discussions, Q&A sessions with experts, and connect with others who understand what you’re going through. Whether you’re a patient or a caregiver, […]

Meningioma Matters – Fri 18th July 1.00pm
We know how hard it can be to live with a meningioma – whether you’re a patient or a caregiver. This space is for you. Join us for a gentle, open conversation with others who truly understand. Share how you’re getting on, talk about what you’re finding difficult, or just listen in. There’s no pressure and […]

Colloid Cyst Community – July Online Meetup: Fri 25th July 1.00pm
A colloid cyst diagnosis can feel isolating, and accessing reliable information or support isn’t always straightforward. This informal online gathering is a space to connect with others who truly understand. Whether you’re living with a cyst yourself or supporting someone who is, you’re warmly invited to join us. There’s no set agenda – just the […]

Calmness & confidence: hypnotherapy workshop – Weds July 30th 7.00pm
This workshop will bring you to the forefront of your life, harnessing the power of neuroscience-informed techniques to anchor you in a state of serene self-assurance.

High grade knowledge share – Thurs July 31st 11.00am
This event is for anyone with a grade 3 or 4 brain tumour who wants more information about treatments that sit outside the NHS protocol. This includes grade 3 astrocytomas, grade 4 glioblastoma, midline gliomas. This is a great group where you can ask about anything related to unproven, innovative and adaptive treatments. This may […]