In Fundraising, Fundraising News

Chris and Dave’s marathon trip home

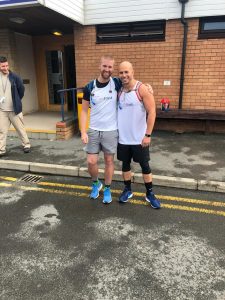
It was a long journey home for Chris Blower and Dave Kerfoot when they laced up their running shoes and set off on foot from their workplace in Samlesbury to their destination of Lytham St Annes.

A marathon for their friend

Normally a short commute in the car, the pair decided to run the distance – a full marathon – to support their colleague and friend Stuart Dolphin, who was diagnosed in 2018 with a grade 4 glioblastoma. Sadly, Stu passed away in May before the big day, so Chris and Dave ran the marathon in his memory.

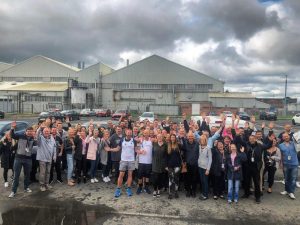
Before they even set foot out of the door of their workplace, BAE Systems, Chris and Dave had already raised more than £8,000. The pair completed the run in four-and-a-half hours, and were welcomed at St Anne’s Pier by friends and relatives.


Speaking before the day, Chris said:

Doing this sponsored run was just one small thing that we hope can go a long way to raising awareness of brain tumour and the charity that supported both Stu and his family. I miss Stu every day at work, and not one day goes by without me thinking of him and his family

Stu’s diagnosis

Stu was just 29 years old when he was diagnosed with a brain tumour after he started suffering headaches, dizzy spells and began to get his words confused. Scans revealed he had a brain tumour. After undergoing surgery to remove the tumour, Stu and his wife Alex were told he had a grade 4 glioblastoma, the most aggressive form of brain cancer.

Stu received a prognosis of 12-18 months. His optimistic approach meant that he remained positive and continued to live his life to the full. He spent every day at hospital for the next six weeks. He received a combination of chemotherapy and radiotherapy. The hope was that the treatment would slow the growth of the tumour.

Sadly, the tumour did not respond to the treatment. More surgery followed, but this time Stu did not recover as well as he did previously. He became very unwell with an infection. He eventually fought off the infection after an extensive stay in hospital. The removal of the tumour had also affected his speech, leaving him struggling to find the right words.

brainstrust‘s support

Stu’s wife Alex said the impact of the diagnosis was hugely challenging for them both and they had been grateful for the support from brainstrust.

She said:

Before his diagnosis, Stu was most happy on the football pitch, playing golf, watching his beloved Preston North End, going to the gym or walking the dog. He worked hard for his career at BAE Systems and enjoyed his job as Project Manager. The thing about brain tumours is that they have a dramatic impact on the quality of life of those affected. Personally, Stu found that his diagnosis left him with physical differences. He faced mobility problems, fatigue, epileptic seizures, weight gain and hair loss. Besides this, he also lost his driving license, was unable to work or play sport, spent less time with friends and lived in a world of uncertainty.

Speaking about the support received, Chris said: “Stu received great support and answers from brainstrust. By going along to one of brainstrust‘s Meetups, his wife and sister were able to meet others in a similar situation and speak to people who truly understood what they were going through”.

“Our charity helps people like Stu and Alex every day, people who are trying to find their way and adjust to a new life after the diagnosis of a brain tumour. At brainstrust we understand just how bewildering and terrifying this can be to both patients and their families. We’d like to say a huge thank you to Chris and Dave, and all the people who have donated to support them. This is an incredible achievement and it means we can carry on providing support for people whenever they need us” – Will Jones, Chief Executive at brainstrust

image 08 03 2019 at 08.44rev istock 836423286 web1200

Introduction

The Brain Tumour Data Dashboard lets you explore up -to-date, population level data about the brain tumours diagnosed in England between 2013 and 2015. Using the drop down menus on the left you can select different groups of patients to view in the charts below. In these charts the number of patients for every 100 diagnoses is displayed as images of people. Patients have been grouped by date of diagnosis, type of tumour, age, gender, and region in England.

For each group of patients you can explore the different routes to diagnosis, the proportion of those who received chemotherapy or radiotherapy, as well as the survival of the patients within each group. For more information about what these metrics mean please see the glossary.

How to use

  1. Select the year of diagnosis using the drop down menu.
  2. Select your patient group of interest from the four drop down menus in the following order:
    1. Tumour group
    2. Age at diagnosis
    3. Region of England
    4. Gender of patient
  3. To view a second chart to compare different groups of patients, click the ‘compare’ button.The second chart will appear below the first chart.

*Note that the tool is best used on a laptop or tablet rather than a mobile phone*

Unavailable data

Some of the data in these charts is not available.There are two main reasons for this:

  1. How the data has been grouped

If you cannot select a patient group from the drop down menus, the data is unavailable because of how the data has been organised.

Public Health England has grouped the data like a branching tree. The bottom of the tree contains all the patients with brain tumours, and then each branch divides the data by a certain characteristics, like age, or location of tumour. But the data is divided in an order, starting with location of the tumour (endocrine or brain), then by age, region, and gender. Age is at the start because it makes a bigger difference to survival rates and treatment rates than gender or region. Sometimes, after the data has been split by type of tumour and age, there is not enough data to be split again. This is because to protect patient confidentiality groups cannot contain less than 100 patients. Because some groups cannot be split further, you cannot create ‘totals’ for everyone by region or gender. For example, you cannot see results for all ages by region, or all brain tumours by gender. If these totals were calculated and released, it might be possible to identify patients, which is why Public Health England cannot release this data.

  1. Statistical reasons and data availability

If you can select a patient group from the chart menus, but the chart does not display, the data is unavailable for one of several reasons:

  1. Data is not yet available for the selected year from Public Health England.
  2. Data is not available because the data quality is too poor to release this statistic.
  3. Data is not available as the statistic is not appropriate for this group.
  4. Data is not available because the standard error of the estimate was greater than 20% and so the estimate has been supressed.

Up to date brain tumour data

Brain tumour data may influence the decisions you make about your care. Data also helps you understand the bigger picture, or landscape, in which you find yourself.

Brain tumour data and statistics influence the focus, and work of organisations like brainstrust. The information helps us to understand the scale and impact of the problems we are setting out to solve.

This tool helps you understand the landscape in which you find yourself having been diagnosed with a brain tumour. This landscape can be particularly tricky to navigate as there are many different types of brain tumour, all of which have a different impact.

The information you see represents the most up-to-date, official, population level brain tumour data available for England. Over time we will be adding to the brain tumour data available and publishing reports, with recommendations, as a result of what we learn from this data.

The data behind this content has come from Public Health England’s National Cancer Registration and Analysis Service (NCRAS) and is a direct result of the ‘Get Data Out’ project.

This project provides anonymised population level brain tumour data for public use in the form of standard output tables, accessible here: http://cancerdata.nhs.uk/standardoutput

Incidence

The number or rate (per head of population) of new cases of a disease diagnosed in a given population during a specified time period (usually a calendar year). The crude rate is the total number of cases divided by the mid-year population, usually expressed per 100,000 population.

Malignant

Malignant tumours which grow by invasion into surrounding tissues and have the ability to metastasise to distant sites

Mortality

The number or rate (per head of population) of deaths in a given population during a specified time period (usually a calendar year). The crude rate is the total number of deaths divided by the mid-year population, usually expressed per 100,000 population.

Non-malignant

Not cancerousNon-malignant tumours may grow larger but do not spread to other parts of the body.

Survival

The length of time from the date of diagnosis for a disease, such as cancer, that patients diagnosed with the disease are still alive. In a clinical trial, measuring the survival is one way to see how well a new treatment works. Also called ‘overall survival’ or ‘OS’.

Routes to Diagnosis

Under the ‘Routes to Diagnosis’ tab in the Brain Tumour Data Dashboard, you can explore the ways patients have been diagnosed with brain tumours. There are many ways, or routes, for cancers to be diagnosed in the NHS. A ‘route to diagnosis’ is the series of events between a patient and the healthcare system that leads to a diagnosis of cancer. The routes include:

  1. Two Week Wait

Patients are urgently referred by their GP for suspected cancer via the Two Week Wait system and are seen by a specialist within 2 weeks where they are diagnosed.

  1. GP referral

Diagnosis via a GP referral includes routine and urgent referrals where the patient was not referred under the Two Week Wait system.

  1. Emergency Presentation

Cancers can be diagnosed via emergency situations such as via A&E, emergency GP referral, emergency transfer or emergency admission.

  1. Outpatient

Outpatient cancer diagnoses include diagnoses via an elective route which started with an outpatient appointment that is either a self-referral or consultant to consultant referral. (It does not include those under the Two Week Wait referral system).

  1. Inpatient elective

Diagnosis via an inpatient elective route is where diagnosis occurs after the patient has been admitted into secondary care from a waiting list, or where the admission is booked or planned.

  1. Death Certificate Only

Diagnoses made by Death Certificate Only are made where there is no more information about the cancer diagnosis other than the cancer related death notifications. The date of diagnosis is the same as that of the date of death.

  1. Unknown

For some patients with a cancer diagnosis, there is no relevant data available to understand the route to diagnosis.


More information

If any of the statistical terms in this section of the brainstrust website are hard to understand, we recommend looking them up here:

Cancer Research UK’s Cancer Statistics Explained

http://www.cancerresearchuk.org/health-professional/cancer-statistics/cancer-stats-explained/statistics-terminology-explained#heading-Seven

If you are looking for help understanding terms relating specifically to brain tumours, and treatment, then the brainstrust glossary is available here:

https://www.brainstrust.org.uk/advice-glossary.php