In Campaign News, Patient story

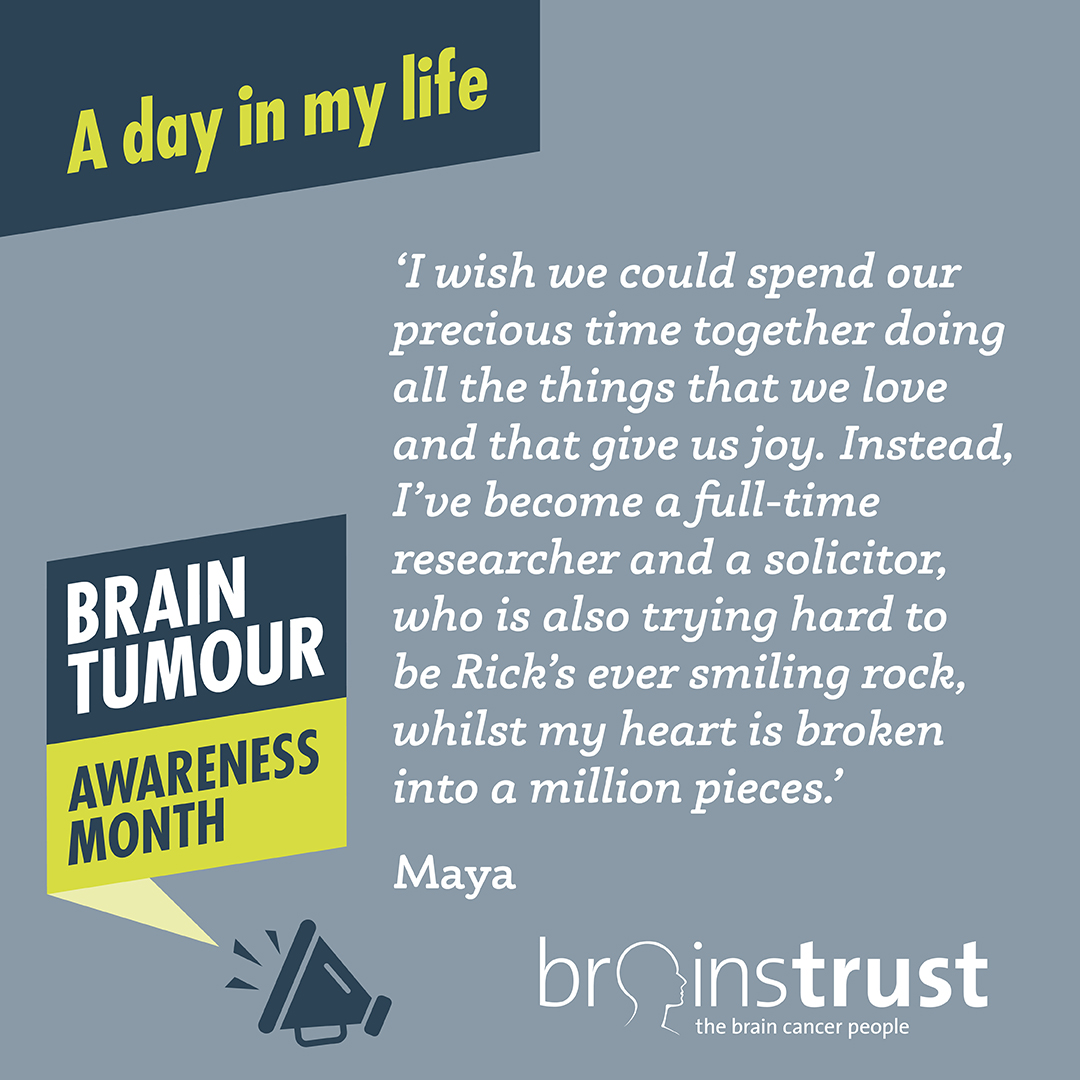
As part of our Brain Tumour Awareness Month 2023 campaign, Maya has written about a day in her life day looking after her husband who has a GBM. If Maya’s experiences resonate with you, brainstrust is here to support you. Visit our dedicated Glioblastoma hub on our website, call 01983 292 405 or email hello@brainstrust.org.uk to get support today.

Maya’s day

7:45 – In my previous life I’d consider this a lie-in but today it feels like the middle of the night. The fact I was up until 2am researching more treatments for glioblastoma probably has something today with that.


9:10 – The time for Rick to have his breakfast is up. His chemo tablets must be taken on an empty stomach, meaning no food for 2 hours before. He has barely managed to touch his breakfast as he’s feeling nauseous, but I have to take it away. He looks up at me surprised – my heart breaks, for the first of many times today.


9:30 – I’m sitting at my desk to write emails to more clinics in Europe and other patients with the same condition in hope to get some reliable information about developing treatments. We’ve tried talking to NHS consultants about it, but we hit the wall of “evidence based treatments”. None of the consultants mention second opinions or recommend colleagues who are more in touch with research. It is so frustrating. Our oncologist told us with a smile on his face that there is no miracle cure for this. His conduct was so cruel and unnecessary, we could not shake it for a week. I considered making a complaint, but I decided the little energy I have is better spent on finding solutions. Rick feels bad seeing I’m putting all these hours into the research. It’s normally he who “sorts things out”. He takes his laptop and is trying to help. After 5 minutes I seen the sheer panic in his eyes, he cannot concentrate because of his debilitating brain fog induced by all the treatment. He gets really upset saying he is an imbecile and how he is supposed to go back to work, my heart breaks again.


11:10 – It is time for his chemo tablets and to leave for the hospital. He is still very upset. I’m struggling to get him out the door without rushing him – I don’t want to make him feel even worse.


12:10 – Radiotherapy done. It only takes 10 minutes, and all the staff are amazing. There’s a huge school-type bell in the waiting area, you get to ring it to mark the end of treatment and everyone claps and cheers, it’s so lovely. I ask Rick if he feels like doing something after the hospital but all he can think about is bed. At the start of the treatment we would go to a nice coffee shop to treat ourselves to lunch, go for a gentle swim or a walk. It was lovely to be able to have a nice time around the treatment – it shrunk hospital visits to a small proportion of our day. It made the time go quick. After week three of Radiotherapy/chemo the fatigue hit him hard overnight and our time is now spent between hospital and home. It seems like the treatment and the side effects will never end.


14:00 – I’m doing last minute preparations before a phone call with Dan. Dan was diagnosed with the same condition as Rick last year. We found out about him from an article in a local newspaper. Rick connected with him on Facebook and he was kind enough to agree to talk to us. From the article we understand Dan is undergoing some treatment in Germany. We are very keen to hear about it from a reliable source, as well as to speak to a “real” person in the same situation. Being affected by such a rare disease makes you feel so alone.


15:30 – The chat with Dan went really well, we talked for ages. He is very happy with his treatment and has extremely good results on it. He also recommended brainstrust – a charity which connects patients with the latest brain tumour research. This is all so positive. I’m grinning. Having a reliable source of information regarding new treatments for brain tumour would be absolutely amazing. It has taken me almost three months to get here, I feel like a criminal trying to access some illegal business. It makes me bitter and angry that our healthcare system makes it so difficult for patients in our situation to access this information.


Evening – We celebrate with a movie and delicious dinner. After all it has been a good day. In the sad world of Glioblastoma, finding people who are willing to help is like a cure on it’s own. I wish we could spend our precious time together doing all the things that we love and that give us joy. Instead, I’ve become a full-time researcher and a solicitor, who is also trying hard to be Rick’s ever smiling rock, whilst my heart is broken into a million pieces.


Support brainstrust this Brain Tumour Awareness Month, help us give a voice to the all too often silent impact of a brain tumour by sharing these stories far and wide:

Facebook | Instagram | Twitter | LinkedIn

We’re fundraising to help us continue our vital services. Every penny raised throughout the month will help ensure that people have the support they need to live their best life possible in the face of the life changing impact of a brain tumour diagnosis.

Donate to the campaign.

Introduction

The Brain Tumour Data Dashboard lets you explore up -to-date, population level data about the brain tumours diagnosed in England between 2013 and 2015. Using the drop down menus on the left you can select different groups of patients to view in the charts below. In these charts the number of patients for every 100 diagnoses is displayed as images of people. Patients have been grouped by date of diagnosis, type of tumour, age, gender, and region in England.

For each group of patients you can explore the different routes to diagnosis, the proportion of those who received chemotherapy or radiotherapy, as well as the survival of the patients within each group. For more information about what these metrics mean please see the glossary.

How to use

  1. Select the year of diagnosis using the drop down menu.
  2. Select your patient group of interest from the four drop down menus in the following order:
    1. Tumour group
    2. Age at diagnosis
    3. Region of England
    4. Gender of patient
  3. To view a second chart to compare different groups of patients, click the ‘compare’ button.The second chart will appear below the first chart.

*Note that the tool is best used on a laptop or tablet rather than a mobile phone*

Unavailable data

Some of the data in these charts is not available.There are two main reasons for this:

  1. How the data has been grouped

If you cannot select a patient group from the drop down menus, the data is unavailable because of how the data has been organised.

Public Health England has grouped the data like a branching tree. The bottom of the tree contains all the patients with brain tumours, and then each branch divides the data by a certain characteristics, like age, or location of tumour. But the data is divided in an order, starting with location of the tumour (endocrine or brain), then by age, region, and gender. Age is at the start because it makes a bigger difference to survival rates and treatment rates than gender or region. Sometimes, after the data has been split by type of tumour and age, there is not enough data to be split again. This is because to protect patient confidentiality groups cannot contain less than 100 patients. Because some groups cannot be split further, you cannot create ‘totals’ for everyone by region or gender. For example, you cannot see results for all ages by region, or all brain tumours by gender. If these totals were calculated and released, it might be possible to identify patients, which is why Public Health England cannot release this data.

  1. Statistical reasons and data availability

If you can select a patient group from the chart menus, but the chart does not display, the data is unavailable for one of several reasons:

  1. Data is not yet available for the selected year from Public Health England.
  2. Data is not available because the data quality is too poor to release this statistic.
  3. Data is not available as the statistic is not appropriate for this group.
  4. Data is not available because the standard error of the estimate was greater than 20% and so the estimate has been supressed.

Up to date brain tumour data

Brain tumour data may influence the decisions you make about your care. Data also helps you understand the bigger picture, or landscape, in which you find yourself.

Brain tumour data and statistics influence the focus, and work of organisations like brainstrust. The information helps us to understand the scale and impact of the problems we are setting out to solve.

This tool helps you understand the landscape in which you find yourself having been diagnosed with a brain tumour. This landscape can be particularly tricky to navigate as there are many different types of brain tumour, all of which have a different impact.

The information you see represents the most up-to-date, official, population level brain tumour data available for England. Over time we will be adding to the brain tumour data available and publishing reports, with recommendations, as a result of what we learn from this data.

The data behind this content has come from Public Health England’s National Cancer Registration and Analysis Service (NCRAS) and is a direct result of the ‘Get Data Out’ project.

This project provides anonymised population level brain tumour data for public use in the form of standard output tables, accessible here: http://cancerdata.nhs.uk/standardoutput

Incidence

The number or rate (per head of population) of new cases of a disease diagnosed in a given population during a specified time period (usually a calendar year). The crude rate is the total number of cases divided by the mid-year population, usually expressed per 100,000 population.

Malignant

Malignant tumours which grow by invasion into surrounding tissues and have the ability to metastasise to distant sites

Mortality

The number or rate (per head of population) of deaths in a given population during a specified time period (usually a calendar year). The crude rate is the total number of deaths divided by the mid-year population, usually expressed per 100,000 population.

Non-malignant

Not cancerousNon-malignant tumours may grow larger but do not spread to other parts of the body.

Survival

The length of time from the date of diagnosis for a disease, such as cancer, that patients diagnosed with the disease are still alive. In a clinical trial, measuring the survival is one way to see how well a new treatment works. Also called ‘overall survival’ or ‘OS’.

Routes to Diagnosis

Under the ‘Routes to Diagnosis’ tab in the Brain Tumour Data Dashboard, you can explore the ways patients have been diagnosed with brain tumours. There are many ways, or routes, for cancers to be diagnosed in the NHS. A ‘route to diagnosis’ is the series of events between a patient and the healthcare system that leads to a diagnosis of cancer. The routes include:

  1. Two Week Wait

Patients are urgently referred by their GP for suspected cancer via the Two Week Wait system and are seen by a specialist within 2 weeks where they are diagnosed.

  1. GP referral

Diagnosis via a GP referral includes routine and urgent referrals where the patient was not referred under the Two Week Wait system.

  1. Emergency Presentation

Cancers can be diagnosed via emergency situations such as via A&E, emergency GP referral, emergency transfer or emergency admission.

  1. Outpatient

Outpatient cancer diagnoses include diagnoses via an elective route which started with an outpatient appointment that is either a self-referral or consultant to consultant referral. (It does not include those under the Two Week Wait referral system).

  1. Inpatient elective

Diagnosis via an inpatient elective route is where diagnosis occurs after the patient has been admitted into secondary care from a waiting list, or where the admission is booked or planned.

  1. Death Certificate Only

Diagnoses made by Death Certificate Only are made where there is no more information about the cancer diagnosis other than the cancer related death notifications. The date of diagnosis is the same as that of the date of death.

  1. Unknown

For some patients with a cancer diagnosis, there is no relevant data available to understand the route to diagnosis.


More information

If any of the statistical terms in this section of the brainstrust website are hard to understand, we recommend looking them up here:

Cancer Research UK’s Cancer Statistics Explained

http://www.cancerresearchuk.org/health-professional/cancer-statistics/cancer-stats-explained/statistics-terminology-explained#heading-Seven

If you are looking for help understanding terms relating specifically to brain tumours, and treatment, then the brainstrust glossary is available here:

https://www.brainstrust.org.uk/advice-glossary.php