In Do your own thing, Fundraising, Uncategorized

How art has helped me on my brain tumour journey, and will continue to do so…

In June 2022 I had my 3rd craniotomy.  The surgeon managed to remove the regrowth as well as some remaining tumour from previous debulking. Once I was healed up again I was put on a different chemotherapy, Lomustine. This was over 6 months. Although I started having seizures from August 2022 and in January 2023 I had two full tonic-clonic seizures in one day my husband called the ambulance as they lasted over 5 minutes I had to be taken to hospital and was then given a much higher dose of anti-seizure medication. Thankfully this is now under control.

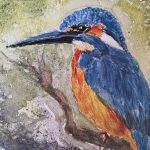
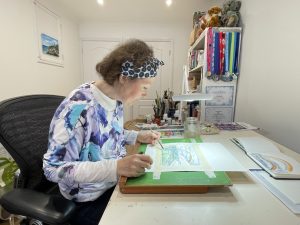
Since my 3rd operation in June 2022, I’ve continued to work on my art and making cards from prints of my originals. I have a steady sale in a coffee shop in my nearest town and twice a year I’m invited with my husband to Buckfast Abbey to the spring and autumn chiropody and podiatry seminars as an honorary member. They allow me to have a trade stand for the delegates to purchase my cards. I try to keep the designs fresh so I’m not taking the same cards each time. 


The November seminar I take Christmas cards. I use 50% of the profits to donate to brain tumour charities. It’s amazing how it adds up and gives me a purpose and feel I’m able to give back something from the charities that have helped me. 

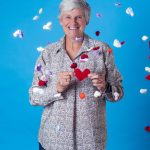
My art work really takes me away from dwelling on all that’s happened and the future. I’m sure it’s helped me emotionally and mentally, my mum always says it’s been my saviour. 

I also donate two paintings a year for The National Brain Appeal, ‘A Letter in Mind’, where you paint on an envelope to be within that year’s title, such as for this this year is a world of colour, to be sold at a London gallery. They all sell for £85, this will be my third year using my art for raising funds for them.  I had always enjoyed arts and crafts since I was old enough to hold a pencil and now since the brain tumour it’s really helped me cope. I feel so thankful to have my sight and ability to still use my hands in the way I always had. 

I’m so pleased I can contribute to future research for treatments and diagnosis to help save lives and improve quality of lives for those like me living with a brain tumour. My prognosis is 3 to 8  years, but as I’ve found out these are just statistics and I refuse to give up on anything I love to  do.

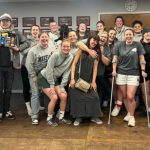
I even completed my winter cold water swimming challenge 2023-2024 at the Bude sea pool  swimming twice a month from November 1st to end of March 2024. We’ve just had our big celebration and presented with medals and certificates. Just shows if you are positive and  determined what you can achieve.


I am grateful to my husband for taking up winter swimming for  the first time to support me as well as the winter Bude sea pool swimming community.  I’ll continue to do my art and swim. Also, I’ve organised a yearly sponsored walk in aid of The Brain Tumour Charity twice and Brain Tumour Research since diagnosis, each time raising around £1,000.  I’m not sure the actual figure raised with my cards but it’s around £500 to £700 a year. 


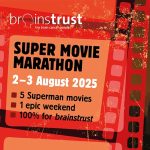
This year I’m donating my fund raising to brainstrust as I have found the hypnotherapy resets with the lovely Louise Baker on Zoom to be so helpful in coping with not only worries of living with a brain tumour, but life in general. Also, brainstrust provide individual support when needed, I appreciate what they provide and feel I can give something back so it can continue as a charity to help others too.  

As long as I’m well enough I’ll endeavour to continue fundraising. I hope I might inspire others to do something for themselves and to raise much needed funds for our brain tumour related charities.

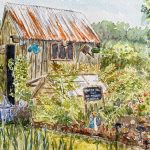
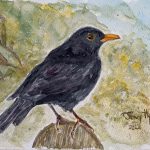
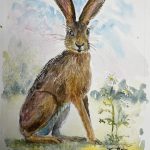
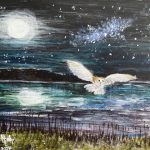
Check out Jenny’s incredible artwork below!


Introduction

The Brain Tumour Data Dashboard lets you explore up -to-date, population level data about the brain tumours diagnosed in England between 2013 and 2015. Using the drop down menus on the left you can select different groups of patients to view in the charts below. In these charts the number of patients for every 100 diagnoses is displayed as images of people. Patients have been grouped by date of diagnosis, type of tumour, age, gender, and region in England.

For each group of patients you can explore the different routes to diagnosis, the proportion of those who received chemotherapy or radiotherapy, as well as the survival of the patients within each group. For more information about what these metrics mean please see the glossary.

How to use

  1. Select the year of diagnosis using the drop down menu.
  2. Select your patient group of interest from the four drop down menus in the following order:
    1. Tumour group
    2. Age at diagnosis
    3. Region of England
    4. Gender of patient
  3. To view a second chart to compare different groups of patients, click the ‘compare’ button.The second chart will appear below the first chart.

*Note that the tool is best used on a laptop or tablet rather than a mobile phone*

Unavailable data

Some of the data in these charts is not available.There are two main reasons for this:

  1. How the data has been grouped

If you cannot select a patient group from the drop down menus, the data is unavailable because of how the data has been organised.

Public Health England has grouped the data like a branching tree. The bottom of the tree contains all the patients with brain tumours, and then each branch divides the data by a certain characteristics, like age, or location of tumour. But the data is divided in an order, starting with location of the tumour (endocrine or brain), then by age, region, and gender. Age is at the start because it makes a bigger difference to survival rates and treatment rates than gender or region. Sometimes, after the data has been split by type of tumour and age, there is not enough data to be split again. This is because to protect patient confidentiality groups cannot contain less than 100 patients. Because some groups cannot be split further, you cannot create ‘totals’ for everyone by region or gender. For example, you cannot see results for all ages by region, or all brain tumours by gender. If these totals were calculated and released, it might be possible to identify patients, which is why Public Health England cannot release this data.

  1. Statistical reasons and data availability

If you can select a patient group from the chart menus, but the chart does not display, the data is unavailable for one of several reasons:

  1. Data is not yet available for the selected year from Public Health England.
  2. Data is not available because the data quality is too poor to release this statistic.
  3. Data is not available as the statistic is not appropriate for this group.
  4. Data is not available because the standard error of the estimate was greater than 20% and so the estimate has been supressed.

Up to date brain tumour data

Brain tumour data may influence the decisions you make about your care. Data also helps you understand the bigger picture, or landscape, in which you find yourself.

Brain tumour data and statistics influence the focus, and work of organisations like brainstrust. The information helps us to understand the scale and impact of the problems we are setting out to solve.

This tool helps you understand the landscape in which you find yourself having been diagnosed with a brain tumour. This landscape can be particularly tricky to navigate as there are many different types of brain tumour, all of which have a different impact.

The information you see represents the most up-to-date, official, population level brain tumour data available for England. Over time we will be adding to the brain tumour data available and publishing reports, with recommendations, as a result of what we learn from this data.

The data behind this content has come from Public Health England’s National Cancer Registration and Analysis Service (NCRAS) and is a direct result of the ‘Get Data Out’ project.

This project provides anonymised population level brain tumour data for public use in the form of standard output tables, accessible here: http://cancerdata.nhs.uk/standardoutput

Incidence

The number or rate (per head of population) of new cases of a disease diagnosed in a given population during a specified time period (usually a calendar year). The crude rate is the total number of cases divided by the mid-year population, usually expressed per 100,000 population.

Malignant

Malignant tumours which grow by invasion into surrounding tissues and have the ability to metastasise to distant sites

Mortality

The number or rate (per head of population) of deaths in a given population during a specified time period (usually a calendar year). The crude rate is the total number of deaths divided by the mid-year population, usually expressed per 100,000 population.

Non-malignant

Not cancerousNon-malignant tumours may grow larger but do not spread to other parts of the body.

Survival

The length of time from the date of diagnosis for a disease, such as cancer, that patients diagnosed with the disease are still alive. In a clinical trial, measuring the survival is one way to see how well a new treatment works. Also called ‘overall survival’ or ‘OS’.

Routes to Diagnosis

Under the ‘Routes to Diagnosis’ tab in the Brain Tumour Data Dashboard, you can explore the ways patients have been diagnosed with brain tumours. There are many ways, or routes, for cancers to be diagnosed in the NHS. A ‘route to diagnosis’ is the series of events between a patient and the healthcare system that leads to a diagnosis of cancer. The routes include:

  1. Two Week Wait

Patients are urgently referred by their GP for suspected cancer via the Two Week Wait system and are seen by a specialist within 2 weeks where they are diagnosed.

  1. GP referral

Diagnosis via a GP referral includes routine and urgent referrals where the patient was not referred under the Two Week Wait system.

  1. Emergency Presentation

Cancers can be diagnosed via emergency situations such as via A&E, emergency GP referral, emergency transfer or emergency admission.

  1. Outpatient

Outpatient cancer diagnoses include diagnoses via an elective route which started with an outpatient appointment that is either a self-referral or consultant to consultant referral. (It does not include those under the Two Week Wait referral system).

  1. Inpatient elective

Diagnosis via an inpatient elective route is where diagnosis occurs after the patient has been admitted into secondary care from a waiting list, or where the admission is booked or planned.

  1. Death Certificate Only

Diagnoses made by Death Certificate Only are made where there is no more information about the cancer diagnosis other than the cancer related death notifications. The date of diagnosis is the same as that of the date of death.

  1. Unknown

For some patients with a cancer diagnosis, there is no relevant data available to understand the route to diagnosis.


More information

If any of the statistical terms in this section of the brainstrust website are hard to understand, we recommend looking them up here:

Cancer Research UK’s Cancer Statistics Explained

http://www.cancerresearchuk.org/health-professional/cancer-statistics/cancer-stats-explained/statistics-terminology-explained#heading-Seven

If you are looking for help understanding terms relating specifically to brain tumours, and treatment, then the brainstrust glossary is available here:

https://www.brainstrust.org.uk/advice-glossary.php