In Do your own thing, Fundraising, Fundraising News

Adam’s up for the Challenge

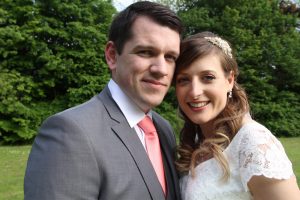
If you keep up to date with the stories we share on social media, you’ll have definitely seen the name Adam Parsons. Adam’s wife, Jenna, sadly passed away last year following her brain tumour diagnosis. In his efforts to fulfil the promise he made to Jenna, Adam continues to take on some of the most adrenaline and endurance filled challenges, all whilst raising vital funds for brainstrust. An inspirational way to honour the endless love and admiration he has for his wife.

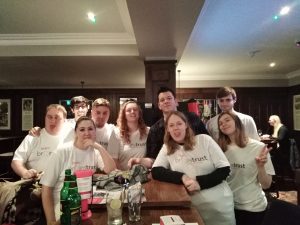
A Journey to Tel Aviv

We first met Adam late last year, as he got ready to conquer the ‘Runaway Challenge’ organised by the Self Defence and Wellbeing Society, Adam instructs at Canterbury Christ Church University. Starting from their student hub, 5 teams had just 36 hours to travel as far as possible using no money for travel, accommodation or food. In true competitive spirit, Adam set his sights on winning the competition. With the help of businesses he encountered, and the kindness he received from strangers, Adam soon found himself landing in Marseilles and then later, Tel Aviv, Israel.

During his first challenge, Adam and his fellow teammates raised a wonderful £1,667.64! Speaking about the challenge, Adam said “I very sadly lost my wife, and this is the best way I can think of to live for her. She loved travelling. She loved adventure.” Having had such an incredible experience, the team are already planning another ‘Runaway Challenge’ which they hope to conquer later this year.

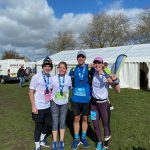
Two Half Marathons in Two Weeks

Yes, you read that right. Two half marathons in two weeks. It’s what Adam set out to do, and it’s exactly what he did.

When he first put his running shoes on, Adam took to the streets of London to complete the Vitality Big Half. When crossing the finish line, Adam was overwhelmed with emotion as he reflected on the reason why he was taking on these challenges and raising funds in loving memory of his wife.

One week later, Adam’s running shoes took him to Cambridge where he completed yet another half marathon. Adam’s passion and resilience shines through and is something we’re constantly in awe of. To describe his determination, Adam said, “There are no challenges on this earth that will match the challenge my wife had to face.”

On the Horizon

“At the moment, we have the Coronavirus crisis going on, so things are not as easy as they had looked. I was down to do the Edinburgh Marathon on 24th May. I was doing that for myself and my wife. Edinburgh was where she wanted to go, and where we didn’t quite make it to in her life. I was running that for her, just a few days from our wedding anniversary. Unfortunately, that has now been rescheduled.”

With other challenges also postponed, such as the Vitality 10k, the Three Peaks Challenge and a trek to Kilimanjaro, Adam is determined to continue his mission. “I have my home office here that is set up for me to be able to work out in. There’s a rowing challenge that I know I can do because i’m just going to get a rowing machine in here (his office). There are all sorts of challenges that I can still do if we get quarantined. There’s still money I’m going to be raising for brainstrust.”

Stay Tuned

To follow Adam on his journey, simply visit his YouTube channel ‘up4thechallenge’ – where he’ll be posting new vlogs every Wednesday at 4pm.

Speaking about brainstrust, Adam said, “They’ve been very kind in the way they’ve treated me, and they were the charity my wife specifically asked me to support. My wife was always right, and that continues. They are a small charity, they help so many people who are suffering. Those who have a diagnosis of brain cancer. Those who are family and friends of those that have been diagnosed. Everyone. It’s a really amazing charity. This is in memory of my wife and in aid of brainstrust, to help others going through what she had to.”


covid 19img 20200308 wa0050

Introduction

The Brain Tumour Data Dashboard lets you explore up -to-date, population level data about the brain tumours diagnosed in England between 2013 and 2015. Using the drop down menus on the left you can select different groups of patients to view in the charts below. In these charts the number of patients for every 100 diagnoses is displayed as images of people. Patients have been grouped by date of diagnosis, type of tumour, age, gender, and region in England.

For each group of patients you can explore the different routes to diagnosis, the proportion of those who received chemotherapy or radiotherapy, as well as the survival of the patients within each group. For more information about what these metrics mean please see the glossary.

How to use

  1. Select the year of diagnosis using the drop down menu.
  2. Select your patient group of interest from the four drop down menus in the following order:
    1. Tumour group
    2. Age at diagnosis
    3. Region of England
    4. Gender of patient
  3. To view a second chart to compare different groups of patients, click the ‘compare’ button.The second chart will appear below the first chart.

*Note that the tool is best used on a laptop or tablet rather than a mobile phone*

Unavailable data

Some of the data in these charts is not available.There are two main reasons for this:

  1. How the data has been grouped

If you cannot select a patient group from the drop down menus, the data is unavailable because of how the data has been organised.

Public Health England has grouped the data like a branching tree. The bottom of the tree contains all the patients with brain tumours, and then each branch divides the data by a certain characteristics, like age, or location of tumour. But the data is divided in an order, starting with location of the tumour (endocrine or brain), then by age, region, and gender. Age is at the start because it makes a bigger difference to survival rates and treatment rates than gender or region. Sometimes, after the data has been split by type of tumour and age, there is not enough data to be split again. This is because to protect patient confidentiality groups cannot contain less than 100 patients. Because some groups cannot be split further, you cannot create ‘totals’ for everyone by region or gender. For example, you cannot see results for all ages by region, or all brain tumours by gender. If these totals were calculated and released, it might be possible to identify patients, which is why Public Health England cannot release this data.

  1. Statistical reasons and data availability

If you can select a patient group from the chart menus, but the chart does not display, the data is unavailable for one of several reasons:

  1. Data is not yet available for the selected year from Public Health England.
  2. Data is not available because the data quality is too poor to release this statistic.
  3. Data is not available as the statistic is not appropriate for this group.
  4. Data is not available because the standard error of the estimate was greater than 20% and so the estimate has been supressed.

Up to date brain tumour data

Brain tumour data may influence the decisions you make about your care. Data also helps you understand the bigger picture, or landscape, in which you find yourself.

Brain tumour data and statistics influence the focus, and work of organisations like brainstrust. The information helps us to understand the scale and impact of the problems we are setting out to solve.

This tool helps you understand the landscape in which you find yourself having been diagnosed with a brain tumour. This landscape can be particularly tricky to navigate as there are many different types of brain tumour, all of which have a different impact.

The information you see represents the most up-to-date, official, population level brain tumour data available for England. Over time we will be adding to the brain tumour data available and publishing reports, with recommendations, as a result of what we learn from this data.

The data behind this content has come from Public Health England’s National Cancer Registration and Analysis Service (NCRAS) and is a direct result of the ‘Get Data Out’ project.

This project provides anonymised population level brain tumour data for public use in the form of standard output tables, accessible here: http://cancerdata.nhs.uk/standardoutput

Incidence

The number or rate (per head of population) of new cases of a disease diagnosed in a given population during a specified time period (usually a calendar year). The crude rate is the total number of cases divided by the mid-year population, usually expressed per 100,000 population.

Malignant

Malignant tumours which grow by invasion into surrounding tissues and have the ability to metastasise to distant sites

Mortality

The number or rate (per head of population) of deaths in a given population during a specified time period (usually a calendar year). The crude rate is the total number of deaths divided by the mid-year population, usually expressed per 100,000 population.

Non-malignant

Not cancerousNon-malignant tumours may grow larger but do not spread to other parts of the body.

Survival

The length of time from the date of diagnosis for a disease, such as cancer, that patients diagnosed with the disease are still alive. In a clinical trial, measuring the survival is one way to see how well a new treatment works. Also called ‘overall survival’ or ‘OS’.

Routes to Diagnosis

Under the ‘Routes to Diagnosis’ tab in the Brain Tumour Data Dashboard, you can explore the ways patients have been diagnosed with brain tumours. There are many ways, or routes, for cancers to be diagnosed in the NHS. A ‘route to diagnosis’ is the series of events between a patient and the healthcare system that leads to a diagnosis of cancer. The routes include:

  1. Two Week Wait

Patients are urgently referred by their GP for suspected cancer via the Two Week Wait system and are seen by a specialist within 2 weeks where they are diagnosed.

  1. GP referral

Diagnosis via a GP referral includes routine and urgent referrals where the patient was not referred under the Two Week Wait system.

  1. Emergency Presentation

Cancers can be diagnosed via emergency situations such as via A&E, emergency GP referral, emergency transfer or emergency admission.

  1. Outpatient

Outpatient cancer diagnoses include diagnoses via an elective route which started with an outpatient appointment that is either a self-referral or consultant to consultant referral. (It does not include those under the Two Week Wait referral system).

  1. Inpatient elective

Diagnosis via an inpatient elective route is where diagnosis occurs after the patient has been admitted into secondary care from a waiting list, or where the admission is booked or planned.

  1. Death Certificate Only

Diagnoses made by Death Certificate Only are made where there is no more information about the cancer diagnosis other than the cancer related death notifications. The date of diagnosis is the same as that of the date of death.

  1. Unknown

For some patients with a cancer diagnosis, there is no relevant data available to understand the route to diagnosis.


More information

If any of the statistical terms in this section of the brainstrust website are hard to understand, we recommend looking them up here:

Cancer Research UK’s Cancer Statistics Explained

http://www.cancerresearchuk.org/health-professional/cancer-statistics/cancer-stats-explained/statistics-terminology-explained#heading-Seven

If you are looking for help understanding terms relating specifically to brain tumours, and treatment, then the brainstrust glossary is available here:

https://www.brainstrust.org.uk/advice-glossary.php