 Hi! I’m Rosie, brainstrust‘s Support Specialist for Wales, Bristol and Liverpool. I’m based in Cardiff. I joined brainstrust in September 2022 after having studied for an MSc in Psychology at Cardiff University. I’ve previously worked in tourism marketing, so this role is quite a change, but in the past I’ve volunteered with caregivers, children with special needs, and people with dementia, so I knew I wanted to help make a difference. I’ve found the role very rewarding so far.
It’s also very varied – my days are always busy, filled with patient support and project work to different degrees. While no two days are the same, hopefully the below will give you an idea of some of the things I get up to in a ‘typical’ day!
9:00-9:30am – I usually start work at 9am. I spend this half hour checking through my email inbox, writing a to-do list in my diary for the day ahead (I’m a big fan of list-making!), and checking our Progress Tracker spreadsheet. The Progress Tracker is a questionnaire we send out to any new patients or caregivers (plus people we’ve supported before; we’re keen to build up data for second trackers, so we can paint a picture of how we’ve helped). It’s a chance for people to reflect on how things are for them. This is so we can offer the most personalised, tailored support. I check this spreadsheet for new responses from people in my regions, and then send them an email to follow up about their answers and see how we can help address specific issues they may have.
 9:30-10:00am – I then have a quick catch-up call with my colleague, Mariel, to talk about an event we’re planning for Liverpool. We’ve been developing a programme of talks and workshops, working with other local organisations and charities, with the aim of boosting wellbeing and resilience for those affected by brain tumours in the region. We have a call to chat through anything that might need doing as a priority over the next few days, whether that’s checking details with the venue, or confirming the programme. After this call I prepare for my next one, with a patient…
10:00-11:00am – This is the first call I have had with this patient – Martin* – and it’s a good chance to hear what’s been going on for him recently. He’s been struggling with the uncertainty and anxiety caused by waiting for his scan results, so we chatted about ways he could feel calmer and more reassured. I mention our wonderful hypnotherapy sessions, and our peer support programme. He is interested in talking to someone else who’s experienced what he’s going through; his situation is sadly far from uncommon.
11:00-11:30am – After my call with Martin, I spend some time logging it on our database, to keep a record of what we spoke about, and send him a follow-up email with useful links and a recap. I also have a tea break!
11:30am-12:30pm – I then have a Zoom meeting with my colleague, Carol, and Louise, who runs our hypnotherapy service. We plan our theme for the next couple of months – a topic that Louise can focus on during her popular two-part sessions, which run twice-monthly. It’s a good opportunity to put our heads together and think about what might be most useful for the community; one of the previous themes has been that of increasing calmness and confidence when facing medical procedures and processes.
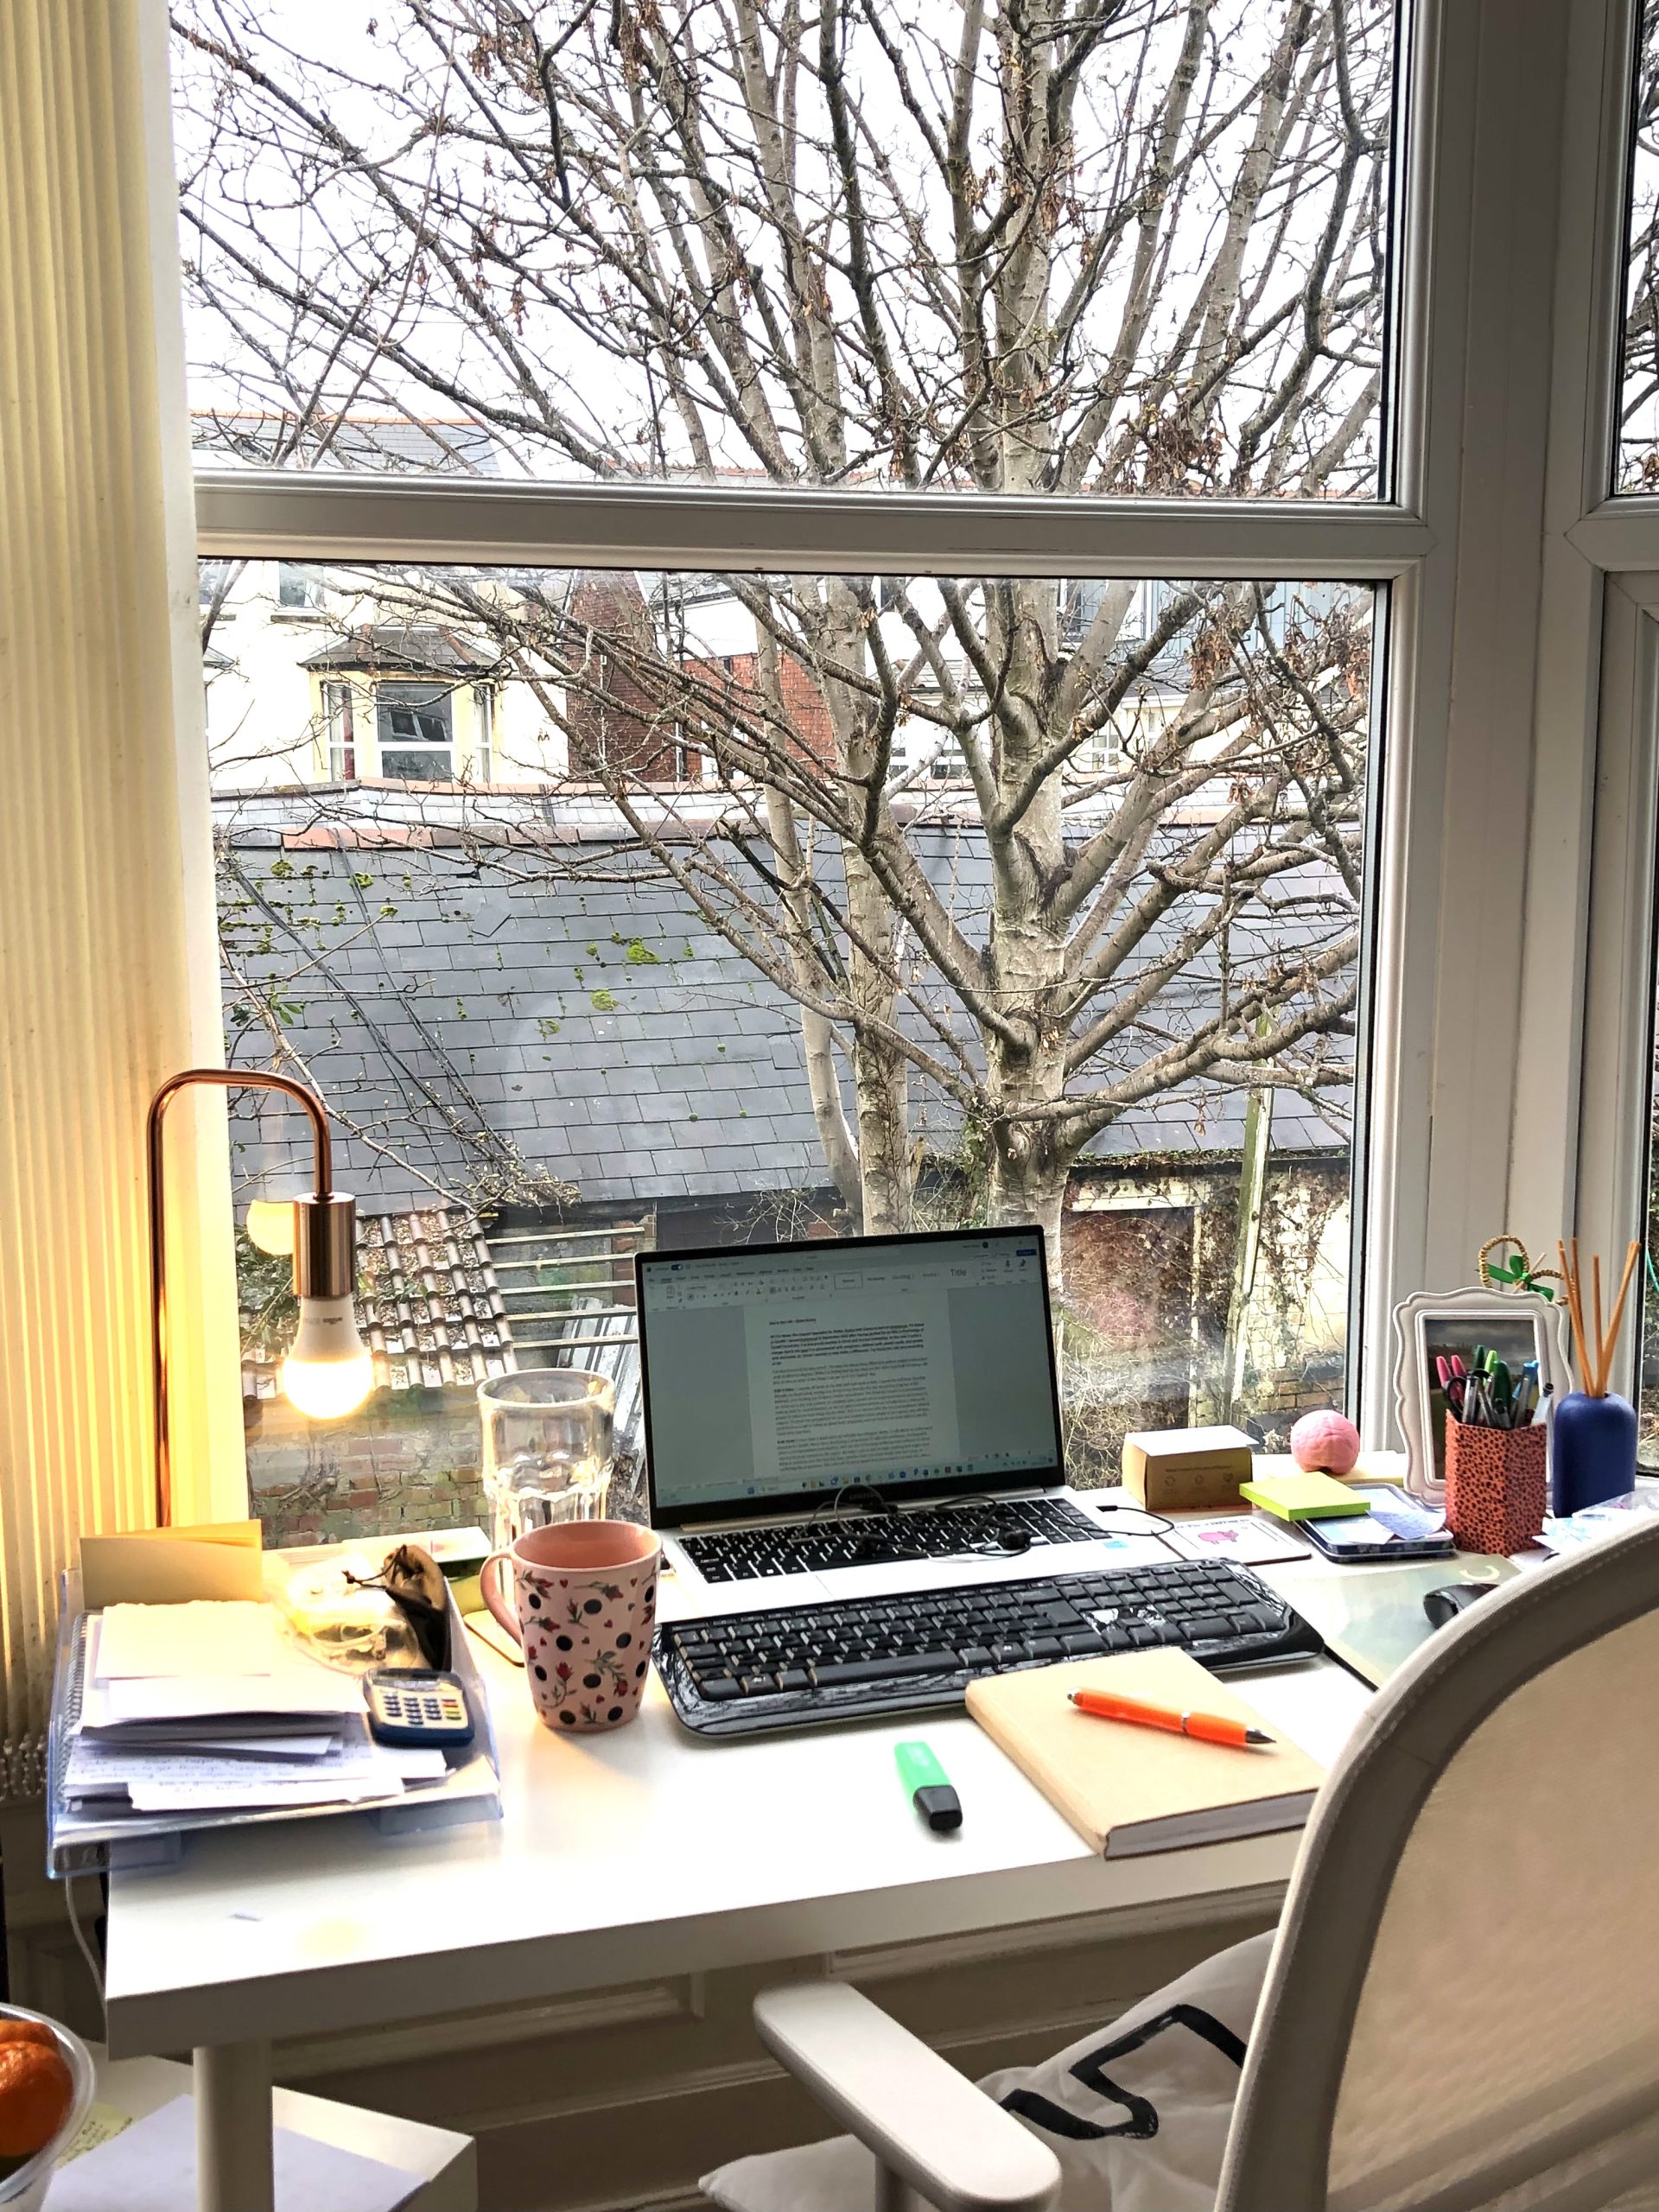
1:00-1:45pm – Lunch time! I find sticking to a routine helps, especially as I work from home. So, around this time each day I have a bite to eat while reading some of my book (I’m trying to read more in my downtime, rather than getting sucked into scrolling social media!). I’ll also try and head out for some fresh air; I’m lucky to live five minutes from a lovely park, so I’ll take a break with a walk. When I’m back at my desk I spend some time getting ready for my next meeting…
2:00-2:45pm – A fair proportion of my work at the moment involves networking and meeting with clinical teams and support workers across my regions’ hospitals and local organisations. This is so I can spread the word about the work we do, and give information for these staff to signpost patients and caregivers to our support. Today I have a great call with an acute oncology team from one of the Welsh hospitals. I present some slides, answer their questions, and send a follow-up email with relevant links.
3:00-4:30pm – I use this time in the afternoon to get stuck into some project work. Whether that’s creating a dedicated section on our website for teenagers and young adults with brain tumours; continuing to develop the plans and programmes for my in-person, local health and wellbeing events later in the year; or sending some information to my colleague, Bridget, to help inform her regional funding and grants applications…there’s lots to be getting on with! Our brainstrust phoneline might also ring in this time- it could be anything – from a fundraising enquiry, to a patient or caregiver wanting some support – so I’ll be sure to do what I can to help.
4:30-4:45pm – Time for a tea and biscuit(s) break. I may try and read a page or two of my book, but I usually end up scrolling on my social media feeds, or gazing out of the window at the birds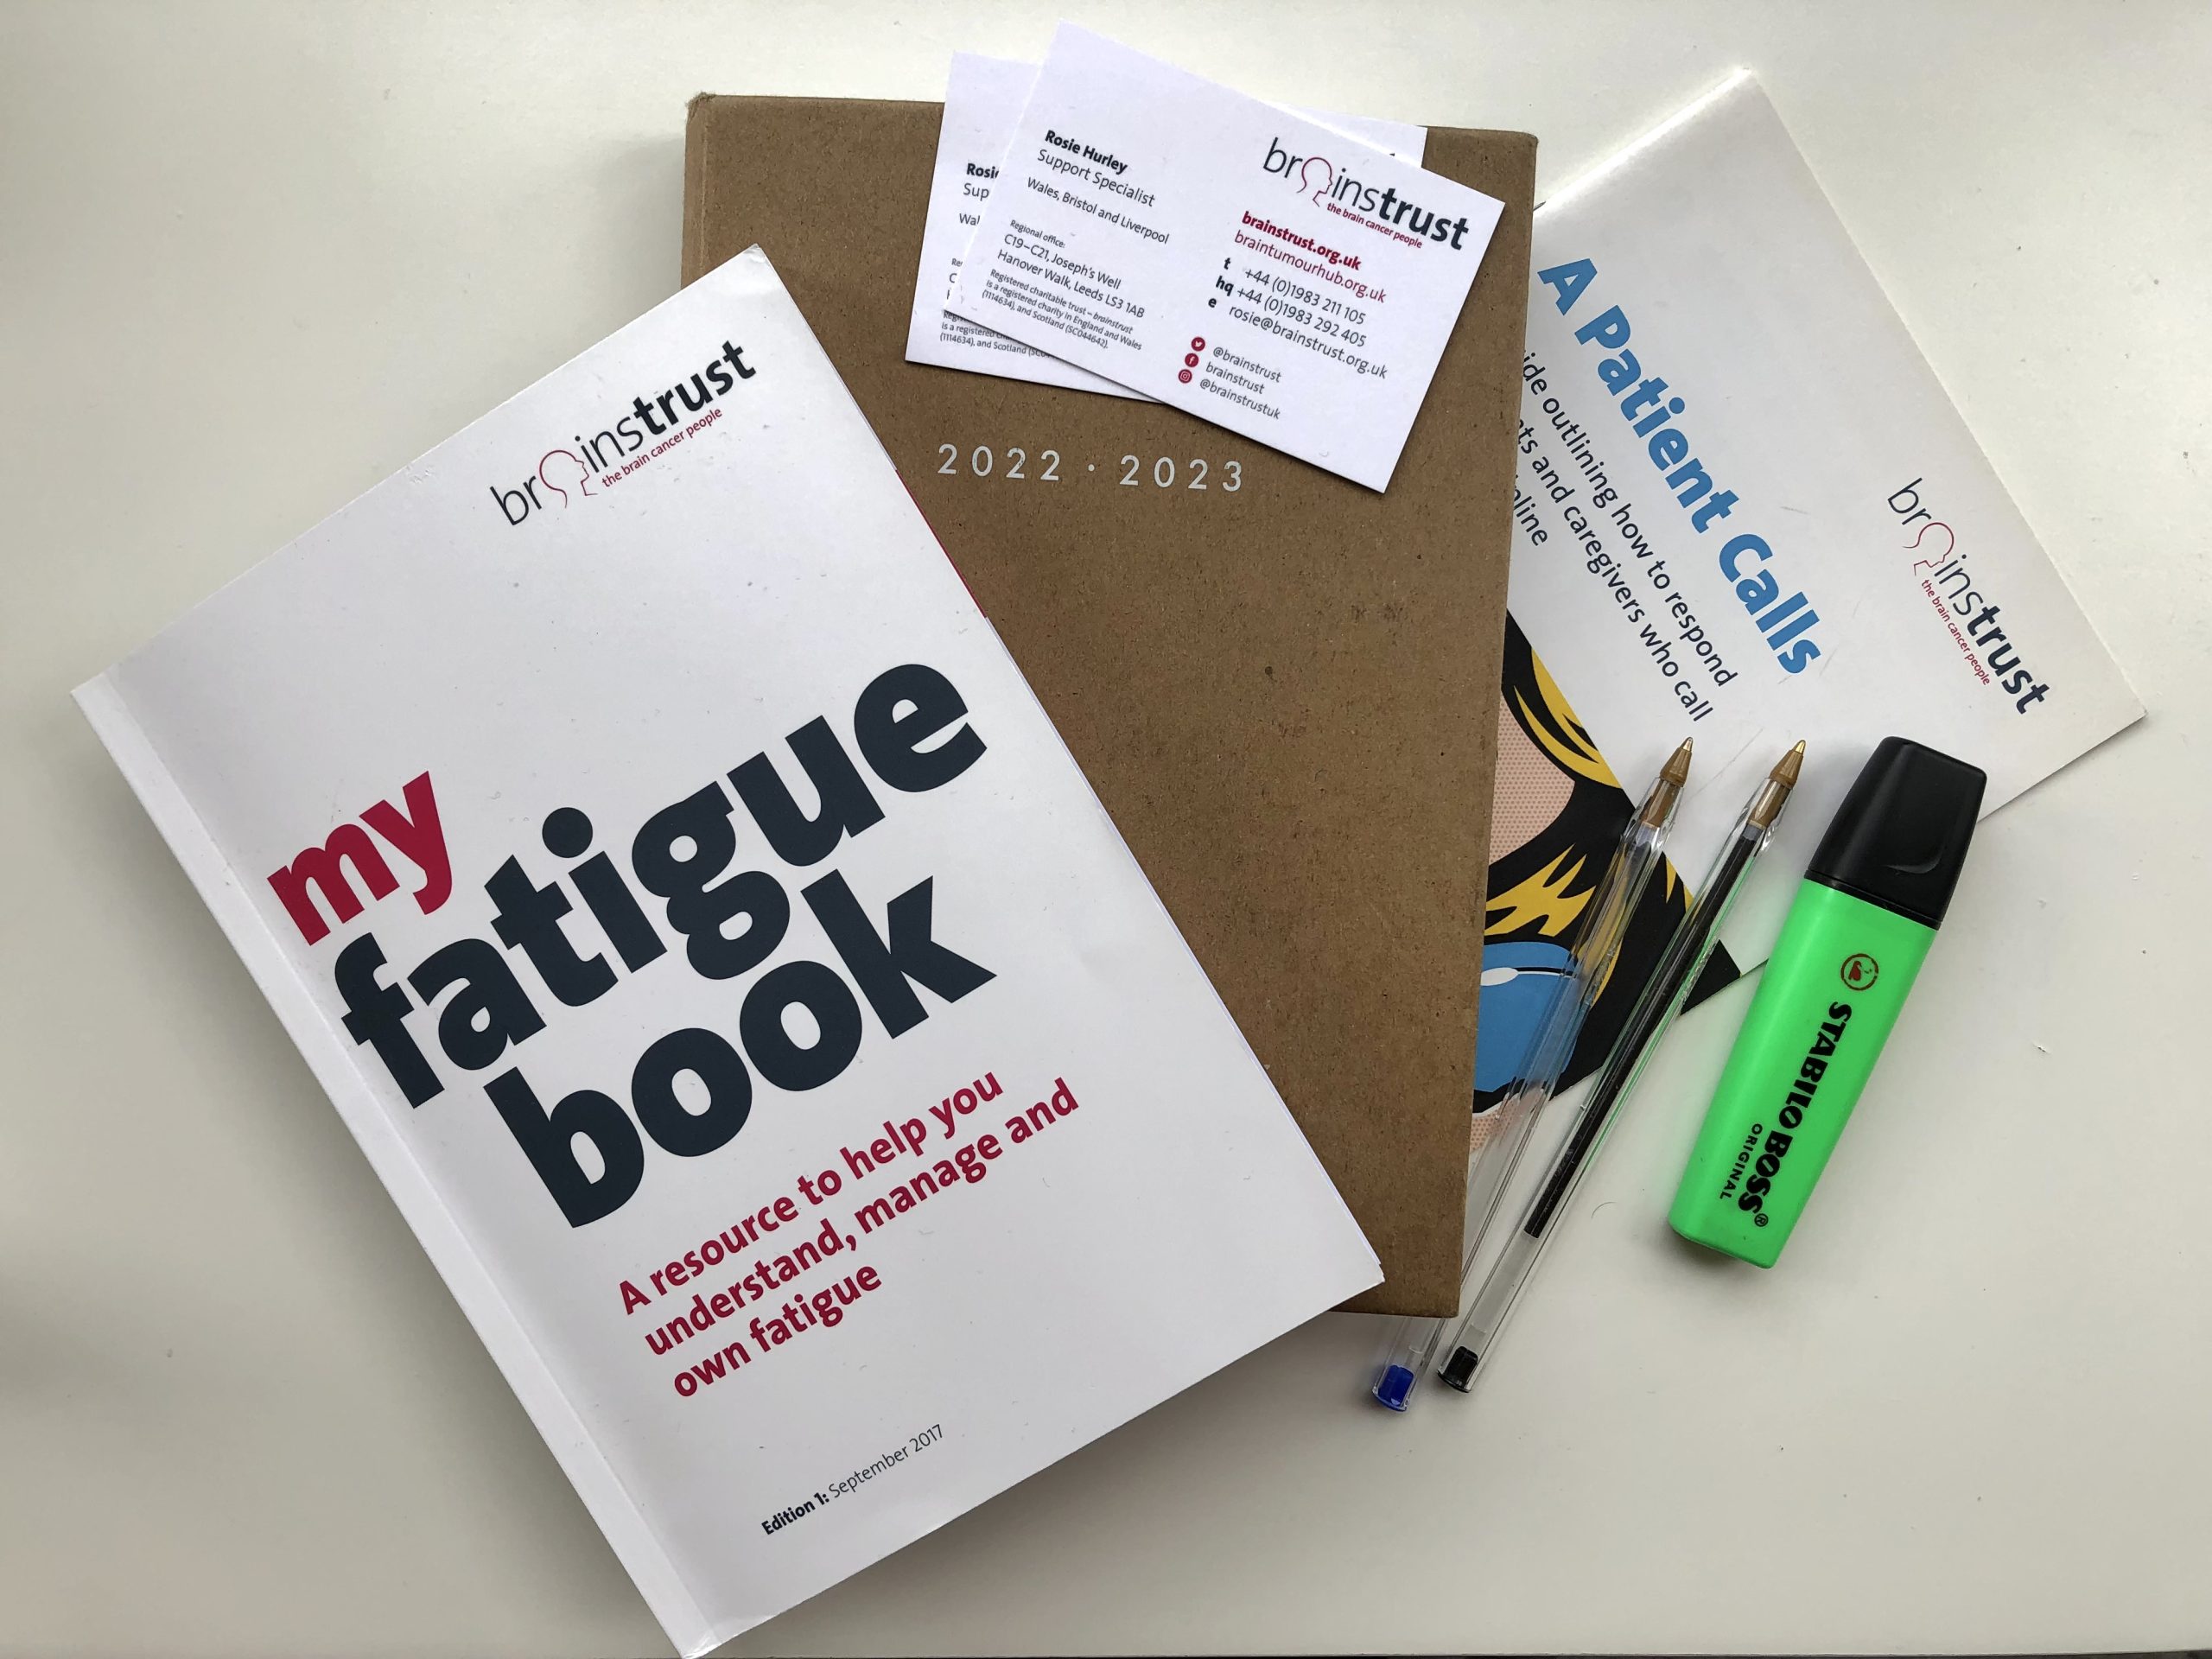 and cats in the neighbours’ gardens.
4:45-5:30pm – It’s nearly the end of the day, so I’ll use this time to get back to my inbox and reply to the emails I need to, plus follow-up from any calls and meetings. The brainstrust team has a Slack message board, with various channels relating to different aspects of our work; while I monitor messages throughout the day, this is a good time to dive in. When I’m at my productive best, too, I try and spend time at the end of each day to write my to-do list for the next – often it ends up being the first task in the morning though, as it was today!
It’s great to get stuck into lots of varied projects, and speaking to different people, whether they’re patients, caregivers, or clinicians. It can be a test of my multitasking sometimes, but working to support three different regions is a great challenge with a great reward.
*Names and certain details have been changed to protect the privacy of the individual.


