In Campaign News, Fundraising News, little brainstrust

“I was alone when I was told my little boy had a brain tumour”

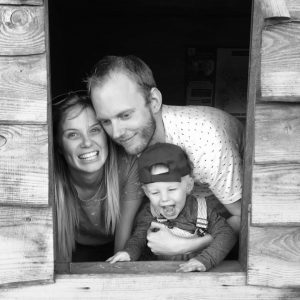
This family’s world was torn apart when their son, Noah, was diagnosed with a brain tumour during the pandemic. The last few months have been a whirlwind, and now Nicci, Tom and Noah have raised thousands to support others that find themselves in this terrifying situation.

When 2-year-old Noah had an MRI scan this August, Covid restrictions meant only one parent could be with him. For four hours, Nicci faced the agonising wait for answers on her own, and then received the news that is every parent’s worst nightmare: her little boy had a brain tumour.

Noah had been diagnosed with epilepsy when he was 11 months old. Until then, he had been a perfectly healthy little boy, achieving all his milestones early and providing no cause for concern. Whilst seeking medical support in the months that followed, the family moved hospitals and consultants. It was then that a routine MRI was requested. The news from the doctor turned their world upside down.

“I was numb,” Nicci says. “I didn’t hear anything else from that conversation. I couldn’t wait for the doctor to leave so I could call my partner. I broke down. My partner was allowed entry to hospital and we both were shown the MRI scans. The tumour was huge. My partner Tom collapsed and was unable to talk.”

What happened next was a blur. A hospital transfer, more MRI scans, blood tests and then Noah’s first surgery to undertake a biopsy. Less than 24 hours after his surgery, Noah was at home playing in the garden, while the family waited to hear from the doctors.

And now we wait…

Throughout this traumatic journey, Noah’s parents have found the waiting has been truly agonising.

“When everything was happening so fast, we didn’t really have time to process anything. The worst part of this entire journey so far was waiting for Noah’s biopsy results. One week passed, which turned into two… then we finally got the call. They told us the tumour wasn’t cancerous – the rest of the call is a blur.”

The family were told that Noah has a DNET tumour, which was likely there during Nicci’s pregnancy. What lies ahead for them is more hospital visits for MRIs, further tests to gather more data about Noah’s tumour, before surgery in the new year.

Support from brainstrust

Nicci reached out to her epilepsy group for support, and a lady mentioned brainstrust, so Nicci reached out.

brainstrust‘s support specialist for children and families has been supporting the family:

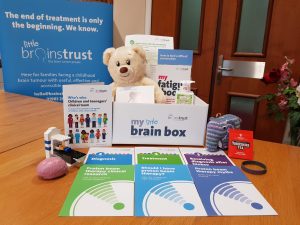
“Nicci reached out to us when her beautiful little boy was newly diagnosed with a brain tumour, it had only been two weeks. I organised for a tailored little brain box to be posted out for Noah. Nicci and I are in regular contact and she knows our 1:1 support is available whenever she needs. Team Noah are real super-heroes, despite going through a difficult time they are supporting us to raise funds and awareness about childhood brain tumours through our Run Row Ride challenge. It is heart-warming to know that we have been able to support Nicci, Tom and Noah through a challenging time and we will continue to do so for as long as they need.”

Little brain boxes are boxes full of resources, information, toys and treats for children with a brain tumour and their loved ones. We tailor the contents of each box to each child’s diagnosis and situation. 

Turning pain into something positive

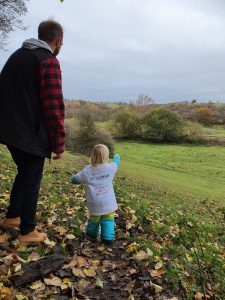
With the road ahead in view, and lots more waiting on the horizon, the family were keen to throw themselves into something to distract them from everything going on. Whilst receiving support from brainstrust, they found the Run, Row, Ride challenge, where participants take on 30 miles over the 30 miles of November for the 30 people diagnosed with a brain tumour every day in the UK.

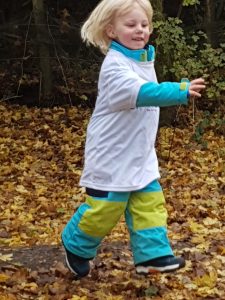
Nicci, Tom and Noah have all taken part in the challenge together.

“The waiting is so difficult, so when we were aware that not much would be happening in November and we saw the challenge we jumped at the chance to give something back to brainstrust.

The challenge has given us so much positivity, from firstly seeing the wonderful messages of support we as a family have had. So many people have reached out to us, it has made the darkest of days a little easier knowing we have so much love behind us.

Secondly, the daily exercise has allowed us all time to look after our mental well-being. We all feel much stronger to face Noah’s mountain.”

The incredible family have raised over £1760 through the challenge, with funds raised going to support other families whose lives have been devastated by a brain tumour diagnosis. You can donate to their fundraising page here: https://www.justgiving.com/fundraising/Nicola-rushton2


covid 19 shielding advicecovid 19 supporting you

Introduction

The Brain Tumour Data Dashboard lets you explore up -to-date, population level data about the brain tumours diagnosed in England between 2013 and 2015. Using the drop down menus on the left you can select different groups of patients to view in the charts below. In these charts the number of patients for every 100 diagnoses is displayed as images of people. Patients have been grouped by date of diagnosis, type of tumour, age, gender, and region in England.

For each group of patients you can explore the different routes to diagnosis, the proportion of those who received chemotherapy or radiotherapy, as well as the survival of the patients within each group. For more information about what these metrics mean please see the glossary.

How to use

  1. Select the year of diagnosis using the drop down menu.
  2. Select your patient group of interest from the four drop down menus in the following order:
    1. Tumour group
    2. Age at diagnosis
    3. Region of England
    4. Gender of patient
  3. To view a second chart to compare different groups of patients, click the ‘compare’ button.The second chart will appear below the first chart.

*Note that the tool is best used on a laptop or tablet rather than a mobile phone*

Unavailable data

Some of the data in these charts is not available.There are two main reasons for this:

  1. How the data has been grouped

If you cannot select a patient group from the drop down menus, the data is unavailable because of how the data has been organised.

Public Health England has grouped the data like a branching tree. The bottom of the tree contains all the patients with brain tumours, and then each branch divides the data by a certain characteristics, like age, or location of tumour. But the data is divided in an order, starting with location of the tumour (endocrine or brain), then by age, region, and gender. Age is at the start because it makes a bigger difference to survival rates and treatment rates than gender or region. Sometimes, after the data has been split by type of tumour and age, there is not enough data to be split again. This is because to protect patient confidentiality groups cannot contain less than 100 patients. Because some groups cannot be split further, you cannot create ‘totals’ for everyone by region or gender. For example, you cannot see results for all ages by region, or all brain tumours by gender. If these totals were calculated and released, it might be possible to identify patients, which is why Public Health England cannot release this data.

  1. Statistical reasons and data availability

If you can select a patient group from the chart menus, but the chart does not display, the data is unavailable for one of several reasons:

  1. Data is not yet available for the selected year from Public Health England.
  2. Data is not available because the data quality is too poor to release this statistic.
  3. Data is not available as the statistic is not appropriate for this group.
  4. Data is not available because the standard error of the estimate was greater than 20% and so the estimate has been supressed.

Up to date brain tumour data

Brain tumour data may influence the decisions you make about your care. Data also helps you understand the bigger picture, or landscape, in which you find yourself.

Brain tumour data and statistics influence the focus, and work of organisations like brainstrust. The information helps us to understand the scale and impact of the problems we are setting out to solve.

This tool helps you understand the landscape in which you find yourself having been diagnosed with a brain tumour. This landscape can be particularly tricky to navigate as there are many different types of brain tumour, all of which have a different impact.

The information you see represents the most up-to-date, official, population level brain tumour data available for England. Over time we will be adding to the brain tumour data available and publishing reports, with recommendations, as a result of what we learn from this data.

The data behind this content has come from Public Health England’s National Cancer Registration and Analysis Service (NCRAS) and is a direct result of the ‘Get Data Out’ project.

This project provides anonymised population level brain tumour data for public use in the form of standard output tables, accessible here: http://cancerdata.nhs.uk/standardoutput

Incidence

The number or rate (per head of population) of new cases of a disease diagnosed in a given population during a specified time period (usually a calendar year). The crude rate is the total number of cases divided by the mid-year population, usually expressed per 100,000 population.

Malignant

Malignant tumours which grow by invasion into surrounding tissues and have the ability to metastasise to distant sites

Mortality

The number or rate (per head of population) of deaths in a given population during a specified time period (usually a calendar year). The crude rate is the total number of deaths divided by the mid-year population, usually expressed per 100,000 population.

Non-malignant

Not cancerousNon-malignant tumours may grow larger but do not spread to other parts of the body.

Survival

The length of time from the date of diagnosis for a disease, such as cancer, that patients diagnosed with the disease are still alive. In a clinical trial, measuring the survival is one way to see how well a new treatment works. Also called ‘overall survival’ or ‘OS’.

Routes to Diagnosis

Under the ‘Routes to Diagnosis’ tab in the Brain Tumour Data Dashboard, you can explore the ways patients have been diagnosed with brain tumours. There are many ways, or routes, for cancers to be diagnosed in the NHS. A ‘route to diagnosis’ is the series of events between a patient and the healthcare system that leads to a diagnosis of cancer. The routes include:

  1. Two Week Wait

Patients are urgently referred by their GP for suspected cancer via the Two Week Wait system and are seen by a specialist within 2 weeks where they are diagnosed.

  1. GP referral

Diagnosis via a GP referral includes routine and urgent referrals where the patient was not referred under the Two Week Wait system.

  1. Emergency Presentation

Cancers can be diagnosed via emergency situations such as via A&E, emergency GP referral, emergency transfer or emergency admission.

  1. Outpatient

Outpatient cancer diagnoses include diagnoses via an elective route which started with an outpatient appointment that is either a self-referral or consultant to consultant referral. (It does not include those under the Two Week Wait referral system).

  1. Inpatient elective

Diagnosis via an inpatient elective route is where diagnosis occurs after the patient has been admitted into secondary care from a waiting list, or where the admission is booked or planned.

  1. Death Certificate Only

Diagnoses made by Death Certificate Only are made where there is no more information about the cancer diagnosis other than the cancer related death notifications. The date of diagnosis is the same as that of the date of death.

  1. Unknown

For some patients with a cancer diagnosis, there is no relevant data available to understand the route to diagnosis.


More information

If any of the statistical terms in this section of the brainstrust website are hard to understand, we recommend looking them up here:

Cancer Research UK’s Cancer Statistics Explained

http://www.cancerresearchuk.org/health-professional/cancer-statistics/cancer-stats-explained/statistics-terminology-explained#heading-Seven

If you are looking for help understanding terms relating specifically to brain tumours, and treatment, then the brainstrust glossary is available here:

https://www.brainstrust.org.uk/advice-glossary.php