In Patient story

Andrew received an Acoustic Neuroma diagnosis at 40 and underwent surgery in 2017. It was upon returning to work that Andrew realised he needed support as fatigue proved incredibly hard to deal with. In this article Andrew has shared his experience of how opening up to the brain tumour community has helped him manage his fatigue in a way that allows him to live life to the full.

I want to tell my story because I know what it’s like and I like giving back and helping others. A lot of people feel isolated and joining meetups and groups helps a lot.  Groups like brainstrust and BANA are great.


My diagnosis

I was 40 when I got diagnosed, it was an Acoustic Neuroma, 3 ½ cm. Surgery was planned in May 2017. I had the surgery on the Monday and got discharged on the Friday.

Before the surgery, I was actually experiencing a lot of symptoms for months, but like other men, I ignored them. My hearing was slightly off on the right side.    Doctors were saying there was nothing wrong. Then my balance was affected. And then I woke up after surgery with grade 6 facial palsy.  I also lost my hearing and balance nerve on my right side. Salford Royal was fantastic with the aftercare and everything.


Reaching out for support

At first, I didn’t think I needed help from charities, but when I got back to work, I realised that I did need help. Fatigue was the biggest issue for me. I went to a conference by BANA and realised how important it is to talk to people. It is life changing. People with Acoustic Neuroma always get dismissed because it’s “benign”.  It was through BANA that I discovered brainstrust – someone talked about the fatigue webinar as fatigue is something that affects me.

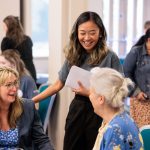
Feeling part of a community is massively important to me. Face to face meetups are really helpful too. You get to talk to people who are experiencing the same things and the people I meet inspire me.


Finding a new normal

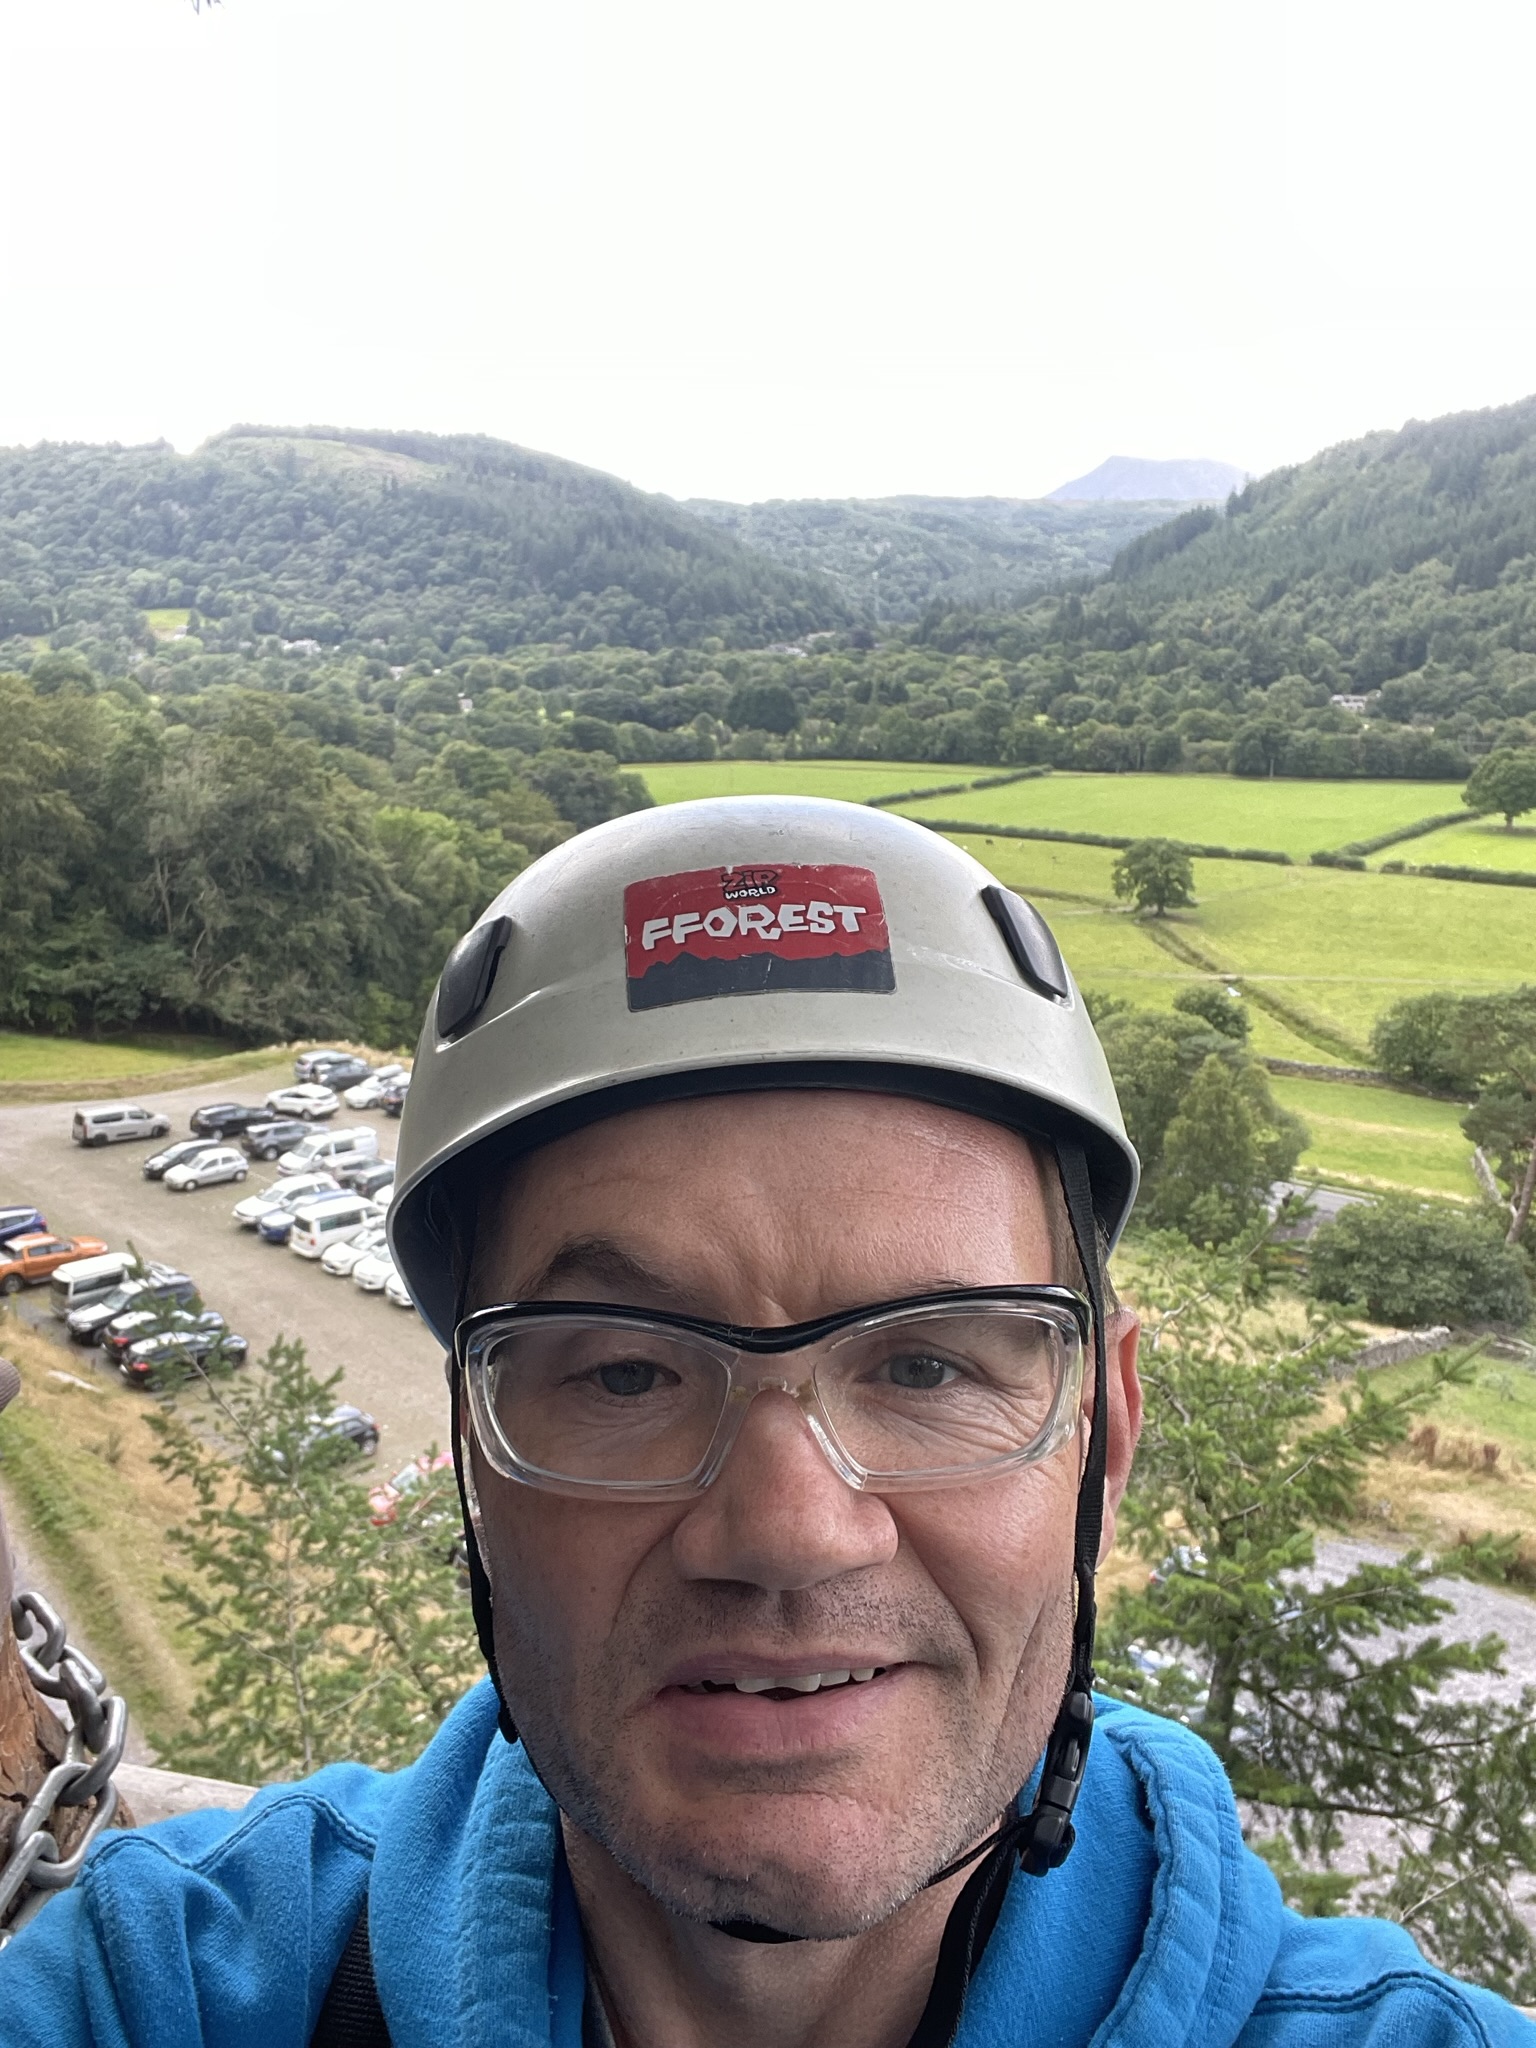
It takes a bit of getting used to. I went back to running and playing football. When I get dizzy, I stop to rest and carry on again. I’ve always been really positive.

I recognise I’m not going back to my normal. It’s my new normal. As soon as you accept it, it becomes easier. I talk to other people who have been through it as well and it helps.

It took about 12 months for me to settle down. I recognise I’m lucky and I think my journey has been a lot easier than other people. One of my main motivators was getting back to work.

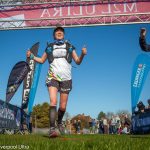
In 2021, I ran 12 marathons in 12 months. Nothing was going to stop me. I do volunteer work for BANA as well and I talk to other patients.


My advice for others experiencing fatigue.

  • Power naps. I need my nap every afternoon and it helps a lot. You’ve got to be more selfish and think about yourself. Put yourself first.
  • Listen to your body. When you feel tired, rest.
  • Exercise. Pick something you enjoy and keep doing it. Make it a habit.
  • Less is more. Prioritise your activities. You don’t have to do everything.
  • Take life one day at a time. Be patient. A lot of people get frustrated when they don’t see progress, but you have to be patient. Patience is a big thing. I hear people saying getting fed up cause they’re not improving, or exercise isn’t helping, but you need to understand that these things may take a while.
  • Self-discipline. This is especially important with exercise. Make it a habit. It’s unbelievable what your body is capable of.


Looking back on the past, I wouldn’t want to change a thing. I feel like this brain tumour diagnosis flipped my life around to the positive. I wasn’t always a positive person, but now I am. I also learned to let go of things that are not in my control.


So, get out there and make some memories.


If you or someone you love has been diagnosed with an Acoustic Neuroma, you can find tailored information, advice and support on our Acoustic Neuroma community page. Click here to visit the Acoustic Neuroma page. If Andrew’s struggle with fatigue resonates with you, brainstrust can support you. To find out more about fatigue management, visit our fatigue page here.

Introduction

The Brain Tumour Data Dashboard lets you explore up -to-date, population level data about the brain tumours diagnosed in England between 2013 and 2015. Using the drop down menus on the left you can select different groups of patients to view in the charts below. In these charts the number of patients for every 100 diagnoses is displayed as images of people. Patients have been grouped by date of diagnosis, type of tumour, age, gender, and region in England.

For each group of patients you can explore the different routes to diagnosis, the proportion of those who received chemotherapy or radiotherapy, as well as the survival of the patients within each group. For more information about what these metrics mean please see the glossary.

How to use

  1. Select the year of diagnosis using the drop down menu.
  2. Select your patient group of interest from the four drop down menus in the following order:
    1. Tumour group
    2. Age at diagnosis
    3. Region of England
    4. Gender of patient
  3. To view a second chart to compare different groups of patients, click the ‘compare’ button.The second chart will appear below the first chart.

*Note that the tool is best used on a laptop or tablet rather than a mobile phone*

Unavailable data

Some of the data in these charts is not available.There are two main reasons for this:

  1. How the data has been grouped

If you cannot select a patient group from the drop down menus, the data is unavailable because of how the data has been organised.

Public Health England has grouped the data like a branching tree. The bottom of the tree contains all the patients with brain tumours, and then each branch divides the data by a certain characteristics, like age, or location of tumour. But the data is divided in an order, starting with location of the tumour (endocrine or brain), then by age, region, and gender. Age is at the start because it makes a bigger difference to survival rates and treatment rates than gender or region. Sometimes, after the data has been split by type of tumour and age, there is not enough data to be split again. This is because to protect patient confidentiality groups cannot contain less than 100 patients. Because some groups cannot be split further, you cannot create ‘totals’ for everyone by region or gender. For example, you cannot see results for all ages by region, or all brain tumours by gender. If these totals were calculated and released, it might be possible to identify patients, which is why Public Health England cannot release this data.

  1. Statistical reasons and data availability

If you can select a patient group from the chart menus, but the chart does not display, the data is unavailable for one of several reasons:

  1. Data is not yet available for the selected year from Public Health England.
  2. Data is not available because the data quality is too poor to release this statistic.
  3. Data is not available as the statistic is not appropriate for this group.
  4. Data is not available because the standard error of the estimate was greater than 20% and so the estimate has been supressed.

Up to date brain tumour data

Brain tumour data may influence the decisions you make about your care. Data also helps you understand the bigger picture, or landscape, in which you find yourself.

Brain tumour data and statistics influence the focus, and work of organisations like brainstrust. The information helps us to understand the scale and impact of the problems we are setting out to solve.

This tool helps you understand the landscape in which you find yourself having been diagnosed with a brain tumour. This landscape can be particularly tricky to navigate as there are many different types of brain tumour, all of which have a different impact.

The information you see represents the most up-to-date, official, population level brain tumour data available for England. Over time we will be adding to the brain tumour data available and publishing reports, with recommendations, as a result of what we learn from this data.

The data behind this content has come from Public Health England’s National Cancer Registration and Analysis Service (NCRAS) and is a direct result of the ‘Get Data Out’ project.

This project provides anonymised population level brain tumour data for public use in the form of standard output tables, accessible here: http://cancerdata.nhs.uk/standardoutput

Incidence

The number or rate (per head of population) of new cases of a disease diagnosed in a given population during a specified time period (usually a calendar year). The crude rate is the total number of cases divided by the mid-year population, usually expressed per 100,000 population.

Malignant

Malignant tumours which grow by invasion into surrounding tissues and have the ability to metastasise to distant sites

Mortality

The number or rate (per head of population) of deaths in a given population during a specified time period (usually a calendar year). The crude rate is the total number of deaths divided by the mid-year population, usually expressed per 100,000 population.

Non-malignant

Not cancerousNon-malignant tumours may grow larger but do not spread to other parts of the body.

Survival

The length of time from the date of diagnosis for a disease, such as cancer, that patients diagnosed with the disease are still alive. In a clinical trial, measuring the survival is one way to see how well a new treatment works. Also called ‘overall survival’ or ‘OS’.

Routes to Diagnosis

Under the ‘Routes to Diagnosis’ tab in the Brain Tumour Data Dashboard, you can explore the ways patients have been diagnosed with brain tumours. There are many ways, or routes, for cancers to be diagnosed in the NHS. A ‘route to diagnosis’ is the series of events between a patient and the healthcare system that leads to a diagnosis of cancer. The routes include:

  1. Two Week Wait

Patients are urgently referred by their GP for suspected cancer via the Two Week Wait system and are seen by a specialist within 2 weeks where they are diagnosed.

  1. GP referral

Diagnosis via a GP referral includes routine and urgent referrals where the patient was not referred under the Two Week Wait system.

  1. Emergency Presentation

Cancers can be diagnosed via emergency situations such as via A&E, emergency GP referral, emergency transfer or emergency admission.

  1. Outpatient

Outpatient cancer diagnoses include diagnoses via an elective route which started with an outpatient appointment that is either a self-referral or consultant to consultant referral. (It does not include those under the Two Week Wait referral system).

  1. Inpatient elective

Diagnosis via an inpatient elective route is where diagnosis occurs after the patient has been admitted into secondary care from a waiting list, or where the admission is booked or planned.

  1. Death Certificate Only

Diagnoses made by Death Certificate Only are made where there is no more information about the cancer diagnosis other than the cancer related death notifications. The date of diagnosis is the same as that of the date of death.

  1. Unknown

For some patients with a cancer diagnosis, there is no relevant data available to understand the route to diagnosis.


More information

If any of the statistical terms in this section of the brainstrust website are hard to understand, we recommend looking them up here:

Cancer Research UK’s Cancer Statistics Explained

http://www.cancerresearchuk.org/health-professional/cancer-statistics/cancer-stats-explained/statistics-terminology-explained#heading-Seven

If you are looking for help understanding terms relating specifically to brain tumours, and treatment, then the brainstrust glossary is available here:

https://www.brainstrust.org.uk/advice-glossary.php