In Do your own thing, Fundraising, Fundraising News

Riding for Margaret

On Saturday 4th June, Kerstin Kramer will take on the 3 Pistes Sportive (the UK’s highest cycle sportive) in support of brainstrust. In an epic challenge, she will be tackling 8 categorised climbs, 5 of the UK’s 6 highest roads and 3 Scottish ski centres – all spanning 103 miles.

When the ride was originally planned, Kerstin and her close friend and fellow GP, Margaret had pledged to conquer this incredible challenge together.  But sadly, last November Margaret was diagnosed with a brain tumour and suddenly had to face a very different type of challenge. In this moment, Margaret and her family reached out to brainstrust for support, and found an understanding community ready to welcome them with open arms. Whilst Margaret had to withdraw from the challenge, Kerstin has chosen to ride in her honour, and has already raised over £2,000 in support of her chosen charity brainstrust, and the wider the brain tumour community.

We reached out to Kerstin ahead of the big day, and loved hearing all about her friendship with Margaret which began 27 years ago.

“My husband joined Margaret’s GP practice in 1995. Right from the beginning [Margaret] inspired me as she managed to combine working and motherhood (3 children), with prize-winning running and cycling performances. A few months later I joined her husband’s practice where I worked for over 20 years. So we have all had a long and close professional/personal relationship. Margaret and her husband were leagues ahead of us in cycling and running, but we were able to enjoy hiking together (though of course I struggled to keep up!)”
“Anyone can suddenly receive a diagnosis of a brain tumour at any time or age. This happened last November to my great friend/retired GP/cycling inspiration/coast-to-coast buddy Margaret. She ‘persuaded’ me to enter this somewhat daunting cycling challenge with her last year, then subsequently received her diagnosis. Margaret is putting her inspiring courage, strength and endurance, developed over her years of elite endurance running and cycling, to good use in dealing with the disease and its treatment, so won’t be on the start line. She and her family have received great support from brainstrust in coping with the disease, [so I’m raising funds] for this important organisation!”
“The reason I’m taking part in the 3 pistes sportive is that Margaret would absolutely love to do it if she could. I am lucky enough to still have my health so am doing it for her, although I will be hours behind her usual speed! If I can raise funds for [this] fantastic charity, that will spur me onto the finish line also.”

Training for the challenge

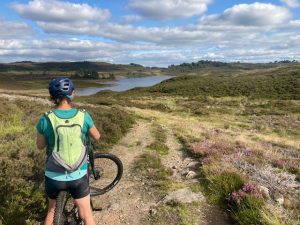
Kerstin has been training for the 3 Pistes Sportive for some time now, and continues to build in confidence.  Her training rides have included events like the The Etape Caledonia, a stunning closed road ride amidst the Scottish Highlands:

“[This] was awesome – my big “training ride” for the 3 pistes. It’s amazing what you can do if you eat enough flapjacks! [It was] a huge help doing it with husband Graham and brother Stewart making a wee team to work together into the head wind. Not far behind was my niece Emma and her mum/my sister-in- law Lesley. Family fun!”
“My next training ride will be 100km over the 2nd Piste (The Lecht). We did the 1st Piste (Glenshee) a couple of weeks ago! We’ll do the Final 3rd Piste (Cairngorm) the weekend before, so at least we will have confronted the demons before Race Day! We are lucky to live locally to the route so it is ‘easy’ to train on the deadly climbs.”

Making a Difference

The challenge ahead is no mean feat, but Kerstin’s passion, determination and inspiration keeps her motivated ahead of the big day. Be sure to keep up with Kerstin’s incredible efforts by following her on JustGiving. Having covered 335.15 km, and with a fundraising total over £2,300 and counting, she’s already accomplished so much to be proud of!
To date, Kerstin’s fantastic fundraising efforts could provide seven patients or caregivers with six counselling sessions. For those overwhelmed by anxiety and struggling to cope, counselling offers a safe and confidential space to talk through feelings, understand emotions and explore steps to make positive change. We provide rapid access to counselling, so people who need this support are not impacted by the usual long wait for such a service.
“Without counselling I would not have been able to face my neuro appointment with such positivity and hope.” – Patient
On behalf of everyone here at brainstrust, we’d like to thank Kerstin and wish her the best of luck ahead of her 3 Pistes Sportive challenge on Saturday 4th June. I’m sure you’ll join us in cheering her on all the way, and we can’t wait to hear how the day unfolds.


If you feel inspired by Kerstin’s story and you want to get involved and support brainstrust, head to our fundraising page to find out about all the ways you be a part of our mission.

The COSMIC project

Introduction

The Brain Tumour Data Dashboard lets you explore up -to-date, population level data about the brain tumours diagnosed in England between 2013 and 2015. Using the drop down menus on the left you can select different groups of patients to view in the charts below. In these charts the number of patients for every 100 diagnoses is displayed as images of people. Patients have been grouped by date of diagnosis, type of tumour, age, gender, and region in England.

For each group of patients you can explore the different routes to diagnosis, the proportion of those who received chemotherapy or radiotherapy, as well as the survival of the patients within each group. For more information about what these metrics mean please see the glossary.

How to use

  1. Select the year of diagnosis using the drop down menu.
  2. Select your patient group of interest from the four drop down menus in the following order:
    1. Tumour group
    2. Age at diagnosis
    3. Region of England
    4. Gender of patient
  3. To view a second chart to compare different groups of patients, click the ‘compare’ button.The second chart will appear below the first chart.

*Note that the tool is best used on a laptop or tablet rather than a mobile phone*

Unavailable data

Some of the data in these charts is not available.There are two main reasons for this:

  1. How the data has been grouped

If you cannot select a patient group from the drop down menus, the data is unavailable because of how the data has been organised.

Public Health England has grouped the data like a branching tree. The bottom of the tree contains all the patients with brain tumours, and then each branch divides the data by a certain characteristics, like age, or location of tumour. But the data is divided in an order, starting with location of the tumour (endocrine or brain), then by age, region, and gender. Age is at the start because it makes a bigger difference to survival rates and treatment rates than gender or region. Sometimes, after the data has been split by type of tumour and age, there is not enough data to be split again. This is because to protect patient confidentiality groups cannot contain less than 100 patients. Because some groups cannot be split further, you cannot create ‘totals’ for everyone by region or gender. For example, you cannot see results for all ages by region, or all brain tumours by gender. If these totals were calculated and released, it might be possible to identify patients, which is why Public Health England cannot release this data.

  1. Statistical reasons and data availability

If you can select a patient group from the chart menus, but the chart does not display, the data is unavailable for one of several reasons:

  1. Data is not yet available for the selected year from Public Health England.
  2. Data is not available because the data quality is too poor to release this statistic.
  3. Data is not available as the statistic is not appropriate for this group.
  4. Data is not available because the standard error of the estimate was greater than 20% and so the estimate has been supressed.

Up to date brain tumour data

Brain tumour data may influence the decisions you make about your care. Data also helps you understand the bigger picture, or landscape, in which you find yourself.

Brain tumour data and statistics influence the focus, and work of organisations like brainstrust. The information helps us to understand the scale and impact of the problems we are setting out to solve.

This tool helps you understand the landscape in which you find yourself having been diagnosed with a brain tumour. This landscape can be particularly tricky to navigate as there are many different types of brain tumour, all of which have a different impact.

The information you see represents the most up-to-date, official, population level brain tumour data available for England. Over time we will be adding to the brain tumour data available and publishing reports, with recommendations, as a result of what we learn from this data.

The data behind this content has come from Public Health England’s National Cancer Registration and Analysis Service (NCRAS) and is a direct result of the ‘Get Data Out’ project.

This project provides anonymised population level brain tumour data for public use in the form of standard output tables, accessible here: http://cancerdata.nhs.uk/standardoutput

Incidence

The number or rate (per head of population) of new cases of a disease diagnosed in a given population during a specified time period (usually a calendar year). The crude rate is the total number of cases divided by the mid-year population, usually expressed per 100,000 population.

Malignant

Malignant tumours which grow by invasion into surrounding tissues and have the ability to metastasise to distant sites

Mortality

The number or rate (per head of population) of deaths in a given population during a specified time period (usually a calendar year). The crude rate is the total number of deaths divided by the mid-year population, usually expressed per 100,000 population.

Non-malignant

Not cancerousNon-malignant tumours may grow larger but do not spread to other parts of the body.

Survival

The length of time from the date of diagnosis for a disease, such as cancer, that patients diagnosed with the disease are still alive. In a clinical trial, measuring the survival is one way to see how well a new treatment works. Also called ‘overall survival’ or ‘OS’.

Routes to Diagnosis

Under the ‘Routes to Diagnosis’ tab in the Brain Tumour Data Dashboard, you can explore the ways patients have been diagnosed with brain tumours. There are many ways, or routes, for cancers to be diagnosed in the NHS. A ‘route to diagnosis’ is the series of events between a patient and the healthcare system that leads to a diagnosis of cancer. The routes include:

  1. Two Week Wait

Patients are urgently referred by their GP for suspected cancer via the Two Week Wait system and are seen by a specialist within 2 weeks where they are diagnosed.

  1. GP referral

Diagnosis via a GP referral includes routine and urgent referrals where the patient was not referred under the Two Week Wait system.

  1. Emergency Presentation

Cancers can be diagnosed via emergency situations such as via A&E, emergency GP referral, emergency transfer or emergency admission.

  1. Outpatient

Outpatient cancer diagnoses include diagnoses via an elective route which started with an outpatient appointment that is either a self-referral or consultant to consultant referral. (It does not include those under the Two Week Wait referral system).

  1. Inpatient elective

Diagnosis via an inpatient elective route is where diagnosis occurs after the patient has been admitted into secondary care from a waiting list, or where the admission is booked or planned.

  1. Death Certificate Only

Diagnoses made by Death Certificate Only are made where there is no more information about the cancer diagnosis other than the cancer related death notifications. The date of diagnosis is the same as that of the date of death.

  1. Unknown

For some patients with a cancer diagnosis, there is no relevant data available to understand the route to diagnosis.


More information

If any of the statistical terms in this section of the brainstrust website are hard to understand, we recommend looking them up here:

Cancer Research UK’s Cancer Statistics Explained

http://www.cancerresearchuk.org/health-professional/cancer-statistics/cancer-stats-explained/statistics-terminology-explained#heading-Seven

If you are looking for help understanding terms relating specifically to brain tumours, and treatment, then the brainstrust glossary is available here:

https://www.brainstrust.org.uk/advice-glossary.php