Described by Danny Jones (of McFly fame) as the ‘loveliest & most upbeat and positive person despite being dealt a pretty crappy card’, the inspirational Dai Knight is recording an album about his brain cancer journey.  Here he tells us why.

“On 28th January 2015, I woke up surrounded by paramedics – I was unsure why. As it turns out I’d had a massive seizure in my sleep.  The only reason I know this is because I was with my new partner and for the previous 8 years I’d been sleeping on my own… looking back I’d had a lot of night time seizures over the few years leading up to this one.

Diagnosis and brain surgery

Once at the hospital I was diagnosed with a “large lesion on my left frontal lobe” – to be perfectly candid, I didn’t understand what that meant. In fact it wasn’t until I overheard someone saying “he has a brain tumour” three days later when I was being discharged that it clicked. Not sure if that makes me really stupid or just a bit naive really, but there we are. So I had surgery to remove as much of the tumour as possible. When they eventually came to speak to me after surgery they told me that it was a low grade 2 Oligodendroglioma – a word that has taken me a long, LONG time to learn how to spell! They had removed about 90% of it and no further treatment necessary. Great!

Back to normality and then disaster strikes once more

Eventually I was back to everyday life. Fast forward to March 2017. I went to Sainsbury’s one day to pick up a few bits, next thing I know I’m waking up on the floor with cuts and bruises all over my face, a chipped tooth, I’d bitten through my tongue and thrown my back out (turns out I face planted a fridge on my way down). I was highly confused and it didn’t hit me until I was in an ambulance on the way to A&E again that I’d had a seizure.

Over the next couple of months came more seizures, fracturing eye sockets (how can you even do that), smashing a huge hole in my nose, lots more tongue bites and back strains. About a week after a seizure I had another MRI scan. After a couple of (stressful) weeks I got the results. Regrowth. Heart – meet floor! Oddly though, the night before getting the results I’d had a dream that I needed chemo and I think that prepared me for it in a way. After some discussion we decided that 6 weeks of radiotherapy and 6 months of chemotherapy should help.

More treatment and dark times

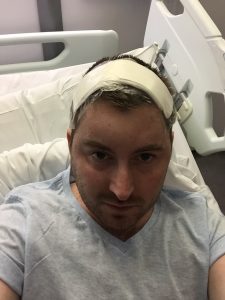
I had my 6 weeks of radiotherapy, last seizure was the beginning of this year. However it took me 9 months to finish my course of chemotherapy because apparently my bone marrow was refusing to do it’s job properly. I was feeling worse and worse and I didn’t realise I was depressed until I got into work one day and couldn’t stop crying! Obviously they sent me home and I was rolling through every emotion under the sun. I didn’t realise how sick I actually was until I began to feel better.

Now, when I first found out I would need chemotherapy I made a deal with my friend Nick; he would finish the book he was writing and self publish and I would write and record a solo album. He’s finished his book and you can buy it on amazon (Nick Spindler: A Layman’s Guide to Space, Time, The Universe and other Unbelievable Stuff).  So I had to write and record my album.


A campaign is born…

I don’t want to go small. I want to go big! I can play all the instruments myself so why not? Not being able to do this very cheaply I started a GoFundMe campaign. Within 2 weeks I’d raised over £4000. I was researching studios and just to get it recorded would cost three quarters of that, leaving me with enough for mixing and mastering. But then how would I be able to raise the money for charity? So I upped my goal to £8000!

There a number of reasons this album would be special to me.  Firstly if I can do anything to help even ONE patient feel better, or feel like there is someone else out there who knows what it’s like to go through what they’re going through, then I’ll be pleased.

I really want to help and entertain people who are bored when sitting through chemo, are angry at so-called friends who bailed as soon as you were diagnosed, the feeling of being hit in the gut by a sledge hammer when you hear the words, “YOU HAVE CANCER” the denial, the rage – but also joy & thankfulness for the people around you, a new outlook on life and even charities that do all they can to help.

Becoming Dai again

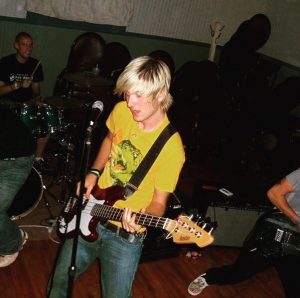
Finally, ever since I was about 10 I dreamt of becoming a rockstar, I was in bands drumming from the age of about 14. I went to America to teach drums, guitar, singing, songwriting and how kids should perform on stage. I’ve been in touring bands, I’ve been a session drummer, I’ve opened for some huge bands. I’ve even played the O2 Arena in London. So this album is my way of expressing the music in me.

My life became all about a brain tumour and it’s like that was the only thing people would talk to me about. This is my way of turning it back to music.

 Music, whether you realise it or not, is one of the most emotional outlets on the planet. Music makes you feel, it makes you laugh, it makes you cry, it’s in the background of every TV show, every advert and every movie. It’s everywhere and I love it. Hopefully you will too.”

We’re excited to be a part of Dai’s journey as he records his album, which he hopes will inspire others.  Any surplus funds raised through his GoFundMe page will be donated brainstrust and Shine Cancer Support.

www.gofundme.com/my-cancer-my-opinions


Introduction

The Brain Tumour Data Dashboard lets you explore up -to-date, population level data about the brain tumours diagnosed in England between 2013 and 2015. Using the drop down menus on the left you can select different groups of patients to view in the charts below. In these charts the number of patients for every 100 diagnoses is displayed as images of people. Patients have been grouped by date of diagnosis, type of tumour, age, gender, and region in England.

For each group of patients you can explore the different routes to diagnosis, the proportion of those who received chemotherapy or radiotherapy, as well as the survival of the patients within each group. For more information about what these metrics mean please see the glossary.

How to use

  1. Select the year of diagnosis using the drop down menu.
  2. Select your patient group of interest from the four drop down menus in the following order:
    1. Tumour group
    2. Age at diagnosis
    3. Region of England
    4. Gender of patient
  3. To view a second chart to compare different groups of patients, click the ‘compare’ button.The second chart will appear below the first chart.

*Note that the tool is best used on a laptop or tablet rather than a mobile phone*

Unavailable data

Some of the data in these charts is not available.There are two main reasons for this:

  1. How the data has been grouped

If you cannot select a patient group from the drop down menus, the data is unavailable because of how the data has been organised.

Public Health England has grouped the data like a branching tree. The bottom of the tree contains all the patients with brain tumours, and then each branch divides the data by a certain characteristics, like age, or location of tumour. But the data is divided in an order, starting with location of the tumour (endocrine or brain), then by age, region, and gender. Age is at the start because it makes a bigger difference to survival rates and treatment rates than gender or region. Sometimes, after the data has been split by type of tumour and age, there is not enough data to be split again. This is because to protect patient confidentiality groups cannot contain less than 100 patients. Because some groups cannot be split further, you cannot create ‘totals’ for everyone by region or gender. For example, you cannot see results for all ages by region, or all brain tumours by gender. If these totals were calculated and released, it might be possible to identify patients, which is why Public Health England cannot release this data.

  1. Statistical reasons and data availability

If you can select a patient group from the chart menus, but the chart does not display, the data is unavailable for one of several reasons:

  1. Data is not yet available for the selected year from Public Health England.
  2. Data is not available because the data quality is too poor to release this statistic.
  3. Data is not available as the statistic is not appropriate for this group.
  4. Data is not available because the standard error of the estimate was greater than 20% and so the estimate has been supressed.

Up to date brain tumour data

Brain tumour data may influence the decisions you make about your care. Data also helps you understand the bigger picture, or landscape, in which you find yourself.

Brain tumour data and statistics influence the focus, and work of organisations like brainstrust. The information helps us to understand the scale and impact of the problems we are setting out to solve.

This tool helps you understand the landscape in which you find yourself having been diagnosed with a brain tumour. This landscape can be particularly tricky to navigate as there are many different types of brain tumour, all of which have a different impact.

The information you see represents the most up-to-date, official, population level brain tumour data available for England. Over time we will be adding to the brain tumour data available and publishing reports, with recommendations, as a result of what we learn from this data.

The data behind this content has come from Public Health England’s National Cancer Registration and Analysis Service (NCRAS) and is a direct result of the ‘Get Data Out’ project.

This project provides anonymised population level brain tumour data for public use in the form of standard output tables, accessible here: http://cancerdata.nhs.uk/standardoutput

Incidence

The number or rate (per head of population) of new cases of a disease diagnosed in a given population during a specified time period (usually a calendar year). The crude rate is the total number of cases divided by the mid-year population, usually expressed per 100,000 population.

Malignant

Malignant tumours which grow by invasion into surrounding tissues and have the ability to metastasise to distant sites

Mortality

The number or rate (per head of population) of deaths in a given population during a specified time period (usually a calendar year). The crude rate is the total number of deaths divided by the mid-year population, usually expressed per 100,000 population.

Non-malignant

Not cancerousNon-malignant tumours may grow larger but do not spread to other parts of the body.

Survival

The length of time from the date of diagnosis for a disease, such as cancer, that patients diagnosed with the disease are still alive. In a clinical trial, measuring the survival is one way to see how well a new treatment works. Also called ‘overall survival’ or ‘OS’.

Routes to Diagnosis

Under the ‘Routes to Diagnosis’ tab in the Brain Tumour Data Dashboard, you can explore the ways patients have been diagnosed with brain tumours. There are many ways, or routes, for cancers to be diagnosed in the NHS. A ‘route to diagnosis’ is the series of events between a patient and the healthcare system that leads to a diagnosis of cancer. The routes include:

  1. Two Week Wait

Patients are urgently referred by their GP for suspected cancer via the Two Week Wait system and are seen by a specialist within 2 weeks where they are diagnosed.

  1. GP referral

Diagnosis via a GP referral includes routine and urgent referrals where the patient was not referred under the Two Week Wait system.

  1. Emergency Presentation

Cancers can be diagnosed via emergency situations such as via A&E, emergency GP referral, emergency transfer or emergency admission.

  1. Outpatient

Outpatient cancer diagnoses include diagnoses via an elective route which started with an outpatient appointment that is either a self-referral or consultant to consultant referral. (It does not include those under the Two Week Wait referral system).

  1. Inpatient elective

Diagnosis via an inpatient elective route is where diagnosis occurs after the patient has been admitted into secondary care from a waiting list, or where the admission is booked or planned.

  1. Death Certificate Only

Diagnoses made by Death Certificate Only are made where there is no more information about the cancer diagnosis other than the cancer related death notifications. The date of diagnosis is the same as that of the date of death.

  1. Unknown

For some patients with a cancer diagnosis, there is no relevant data available to understand the route to diagnosis.


More information

If any of the statistical terms in this section of the brainstrust website are hard to understand, we recommend looking them up here:

Cancer Research UK’s Cancer Statistics Explained

http://www.cancerresearchuk.org/health-professional/cancer-statistics/cancer-stats-explained/statistics-terminology-explained#heading-Seven

If you are looking for help understanding terms relating specifically to brain tumours, and treatment, then the brainstrust glossary is available here:

https://www.brainstrust.org.uk/advice-glossary.php