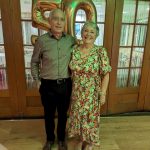
Richard’s Story

Richard was born on 1st February 1944.  He was adopted at 6 months old by Ronald and Mary Raven and lived at Park Farm, Wrentham. He attended Wrentham primary school until the age of 11 when he moved on to Lowestoft Grammar School. After Grammar School he attended Kessingland Upper School. On finishing school he then completed an Engineering Course at Lowestoft Tech. He then moved on to Chadacre Agricultural College near Bury St Edmunds, following in the footsteps of his father. He excelled in sports at both School and College gaining three Victor Ludorium awards. College was hard work but Richard still managed to get into ‘mischief’, by sneaking out  but was caught out on many occasions, but this didn’t dampen his sense of adventure.  He enjoyed a colourful social life from a young age.

In 1962 Richard joined his father working at Park Farm where he began his farming career.

He discovered a love of ice skating at Great Yarmouth with partner Annie Wharton. To his delight they were later featured on the front cover of the Great Yarmouth summer holiday brochure. He made great lifelong friendships during his skating days. Sadly though the skating rink was later closed and he would therefore have to find other ways of entertainment. More on that later…
Richard married Tina and Jonathan was born in 1972.

He became a retained fire fighter at Wrentham Fire Station. He was fearless and loved nothing more than getting behind the wheel of the fire engine whenever possible.  If he missed the shout he would normally follow in hot pursuit in his rally car beating the engine to the incident.

In the 1970’s he took up Rallying as a hobby. Competing in stage rallies all over the country with his navigator Gary Martin, winning numerous trophies, with his indecently fast driving. A collision with a concrete bridge at 90 miles an hour abruptly ended his rally career, luckily escaping with only a broken finger.

In 1978 he married Helen. His father then retired and Richard took over the tenancy at Park Farm. Helen and Richard then moved in to Park Farm House in Mill Lane. Kirsty was born in 1983.

The need for speed was shortly replaced by another form of horse power when he decided to learn to ride on an ex race horse called Bill. Numerous horses followed, last of which was Clancy his big white charger and they were often seen trotting flat out along the A12.

Richard was a member of Wrentham Vegetables, where he was one of the first members to master the computer system He also enjoyed the short asparagus season, which included delivering the product to many local establishments. He also enjoyed passing on the recipe for his Famous Asparagus Soup.

Jessica was then born in 1993.

Richard decided to turn his hand to sheep farming. He established an award winning pedigree flock of East Point Texel sheep, attending many shows all over the country with the help of his girls. Kirsty and Jessica attended The Old School Henstead and he became a great follower of the School Choir. He later joined the Choir performing at the Carol service at Henstead Church several years in a row.

For years Richard always thought that he was an only child and was surprised to discover that he was actually one of eight when his half sister Ruby got in contact. He formed good relationships with all brothers and sisters.

Richard moved farms to Pye’s Hall in 1997.

Richard was very proud when Jonathan and Lindsey made him a grandfather in 2007. Little Harry brought great joy to his life.

He retired from farming in 2009 and was very proud to have been able to buy back Gulahek his Grandfather’s House. This was to have been  a retirement project  in the way of its renovation of house and garden.

Richard was proud of all his family’s achievements and would not tire of telling anyone who would listen.  He was overjoyed when Jonathan joined the Adnams team and during his illness he joined him several times delivering beer all over east Anglia. He was proud when Kirsty gained her nursing degree and experienced the care of her fantastic team on EADU several times. Jessica will always be his beautiful baby girl and he was always confident she will do well in whatever she wanted. He also became a keen supporter of Hales Cricket club following his son in law Matthew’s achievements. Richard was one of life’s great pranksters. Ask poor Wally Clarke about his memorable bird sandwich…

He also had a heart of gold and would go out of his way to help anyone in need, he helped so many people after the Wrentham flood.

One of Richard’s greatest passions was cooking, with his love of the hottest chills, the rarest beef , and the strongest garlic.

He remained upbeat throughout his illness, thankfully never losing his sense of humour. Together with the support of his family he fought his illness.

Richard was diagnosed with Glioblastoma Multiforme in March 2010. He was treated at Addenbrookes Hospital  but sadly he died 13.3.11. The family wish to thank the oncology team for everything they did and feel that his treatment was excellent at Addenbrookes and James Paget Hospital and also the excellent care of all the Pallitive Care team, and our wonderful GP.

460 people attended his funeral at Wrentham Parish Church on 29.3.11. Richard was 67. He had only retired from farming in October 2009.

With brainstrust, you are never alone. Click here to get in touch with one of our trained volunteers who has been through the same experiences you are going through.

Introduction

The Brain Tumour Data Dashboard lets you explore up -to-date, population level data about the brain tumours diagnosed in England between 2013 and 2015. Using the drop down menus on the left you can select different groups of patients to view in the charts below. In these charts the number of patients for every 100 diagnoses is displayed as images of people. Patients have been grouped by date of diagnosis, type of tumour, age, gender, and region in England.

For each group of patients you can explore the different routes to diagnosis, the proportion of those who received chemotherapy or radiotherapy, as well as the survival of the patients within each group. For more information about what these metrics mean please see the glossary.

How to use

  1. Select the year of diagnosis using the drop down menu.
  2. Select your patient group of interest from the four drop down menus in the following order:
    1. Tumour group
    2. Age at diagnosis
    3. Region of England
    4. Gender of patient
  3. To view a second chart to compare different groups of patients, click the ‘compare’ button.The second chart will appear below the first chart.

*Note that the tool is best used on a laptop or tablet rather than a mobile phone*

Unavailable data

Some of the data in these charts is not available.There are two main reasons for this:

  1. How the data has been grouped

If you cannot select a patient group from the drop down menus, the data is unavailable because of how the data has been organised.

Public Health England has grouped the data like a branching tree. The bottom of the tree contains all the patients with brain tumours, and then each branch divides the data by a certain characteristics, like age, or location of tumour. But the data is divided in an order, starting with location of the tumour (endocrine or brain), then by age, region, and gender. Age is at the start because it makes a bigger difference to survival rates and treatment rates than gender or region. Sometimes, after the data has been split by type of tumour and age, there is not enough data to be split again. This is because to protect patient confidentiality groups cannot contain less than 100 patients. Because some groups cannot be split further, you cannot create ‘totals’ for everyone by region or gender. For example, you cannot see results for all ages by region, or all brain tumours by gender. If these totals were calculated and released, it might be possible to identify patients, which is why Public Health England cannot release this data.

  1. Statistical reasons and data availability

If you can select a patient group from the chart menus, but the chart does not display, the data is unavailable for one of several reasons:

  1. Data is not yet available for the selected year from Public Health England.
  2. Data is not available because the data quality is too poor to release this statistic.
  3. Data is not available as the statistic is not appropriate for this group.
  4. Data is not available because the standard error of the estimate was greater than 20% and so the estimate has been supressed.

Up to date brain tumour data

Brain tumour data may influence the decisions you make about your care. Data also helps you understand the bigger picture, or landscape, in which you find yourself.

Brain tumour data and statistics influence the focus, and work of organisations like brainstrust. The information helps us to understand the scale and impact of the problems we are setting out to solve.

This tool helps you understand the landscape in which you find yourself having been diagnosed with a brain tumour. This landscape can be particularly tricky to navigate as there are many different types of brain tumour, all of which have a different impact.

The information you see represents the most up-to-date, official, population level brain tumour data available for England. Over time we will be adding to the brain tumour data available and publishing reports, with recommendations, as a result of what we learn from this data.

The data behind this content has come from Public Health England’s National Cancer Registration and Analysis Service (NCRAS) and is a direct result of the ‘Get Data Out’ project.

This project provides anonymised population level brain tumour data for public use in the form of standard output tables, accessible here: http://cancerdata.nhs.uk/standardoutput

Incidence

The number or rate (per head of population) of new cases of a disease diagnosed in a given population during a specified time period (usually a calendar year). The crude rate is the total number of cases divided by the mid-year population, usually expressed per 100,000 population.

Malignant

Malignant tumours which grow by invasion into surrounding tissues and have the ability to metastasise to distant sites

Mortality

The number or rate (per head of population) of deaths in a given population during a specified time period (usually a calendar year). The crude rate is the total number of deaths divided by the mid-year population, usually expressed per 100,000 population.

Non-malignant

Not cancerousNon-malignant tumours may grow larger but do not spread to other parts of the body.

Survival

The length of time from the date of diagnosis for a disease, such as cancer, that patients diagnosed with the disease are still alive. In a clinical trial, measuring the survival is one way to see how well a new treatment works. Also called ‘overall survival’ or ‘OS’.

Routes to Diagnosis

Under the ‘Routes to Diagnosis’ tab in the Brain Tumour Data Dashboard, you can explore the ways patients have been diagnosed with brain tumours. There are many ways, or routes, for cancers to be diagnosed in the NHS. A ‘route to diagnosis’ is the series of events between a patient and the healthcare system that leads to a diagnosis of cancer. The routes include:

  1. Two Week Wait

Patients are urgently referred by their GP for suspected cancer via the Two Week Wait system and are seen by a specialist within 2 weeks where they are diagnosed.

  1. GP referral

Diagnosis via a GP referral includes routine and urgent referrals where the patient was not referred under the Two Week Wait system.

  1. Emergency Presentation

Cancers can be diagnosed via emergency situations such as via A&E, emergency GP referral, emergency transfer or emergency admission.

  1. Outpatient

Outpatient cancer diagnoses include diagnoses via an elective route which started with an outpatient appointment that is either a self-referral or consultant to consultant referral. (It does not include those under the Two Week Wait referral system).

  1. Inpatient elective

Diagnosis via an inpatient elective route is where diagnosis occurs after the patient has been admitted into secondary care from a waiting list, or where the admission is booked or planned.

  1. Death Certificate Only

Diagnoses made by Death Certificate Only are made where there is no more information about the cancer diagnosis other than the cancer related death notifications. The date of diagnosis is the same as that of the date of death.

  1. Unknown

For some patients with a cancer diagnosis, there is no relevant data available to understand the route to diagnosis.


More information

If any of the statistical terms in this section of the brainstrust website are hard to understand, we recommend looking them up here:

Cancer Research UK’s Cancer Statistics Explained

http://www.cancerresearchuk.org/health-professional/cancer-statistics/cancer-stats-explained/statistics-terminology-explained#heading-Seven

If you are looking for help understanding terms relating specifically to brain tumours, and treatment, then the brainstrust glossary is available here:

https://www.brainstrust.org.uk/advice-glossary.php