In Fundraising

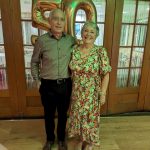
Despite suffering from motion sickness, Lynn Crichton was determined to skydive 10,000 feet out of a plane in memory of her fiancé, Garreth, who sadly died of a brain tumour in 2012.

Garreth was a very outgoing and adventure-loving person, so a skydive is exactly the sort of challenge that would have got his stamp of approval.

“Garreth had lots of friends and was loved by everyone who knew him,” says Lynn. “He was a very positive person and always gave lots of good advice and encouragement. He had done lots of travelling, and he’d done a bungee jump, so he would have been thrilled at me doing a skydive!”


Lynn wanted to raise funds in Garreth’s memory, so contacted brainstrust for more information. “I was impressed by the personal service I received,’ says Lynn. So much so, that she decided to start fundraising to help the thousands of people in the UK with a brain tumour.

She got involved in Teafest, followed shortly after by a 12-mile cycle ride. For her next challenge, she was persuaded by her friend Carol Cochrane, who is also brainstrust’s community fundraiser and support specialist in Scotland, to do something that was a little bit different.

A 10,000 feet skydive.

“My lovely friend Carol sent me a text last October saying ‘I may have a slightly mad fundraiser for us. I’m fairly game. I just need a partner in crime!’”

After receiving the text, Lynn didn’t commit to anything, but then she decided to go for it. “It was something really out of my comfort zone,” says Lynn. I had done an abseil a few years ago, and had always fancied doing another one, but this was even more of a challenge.”

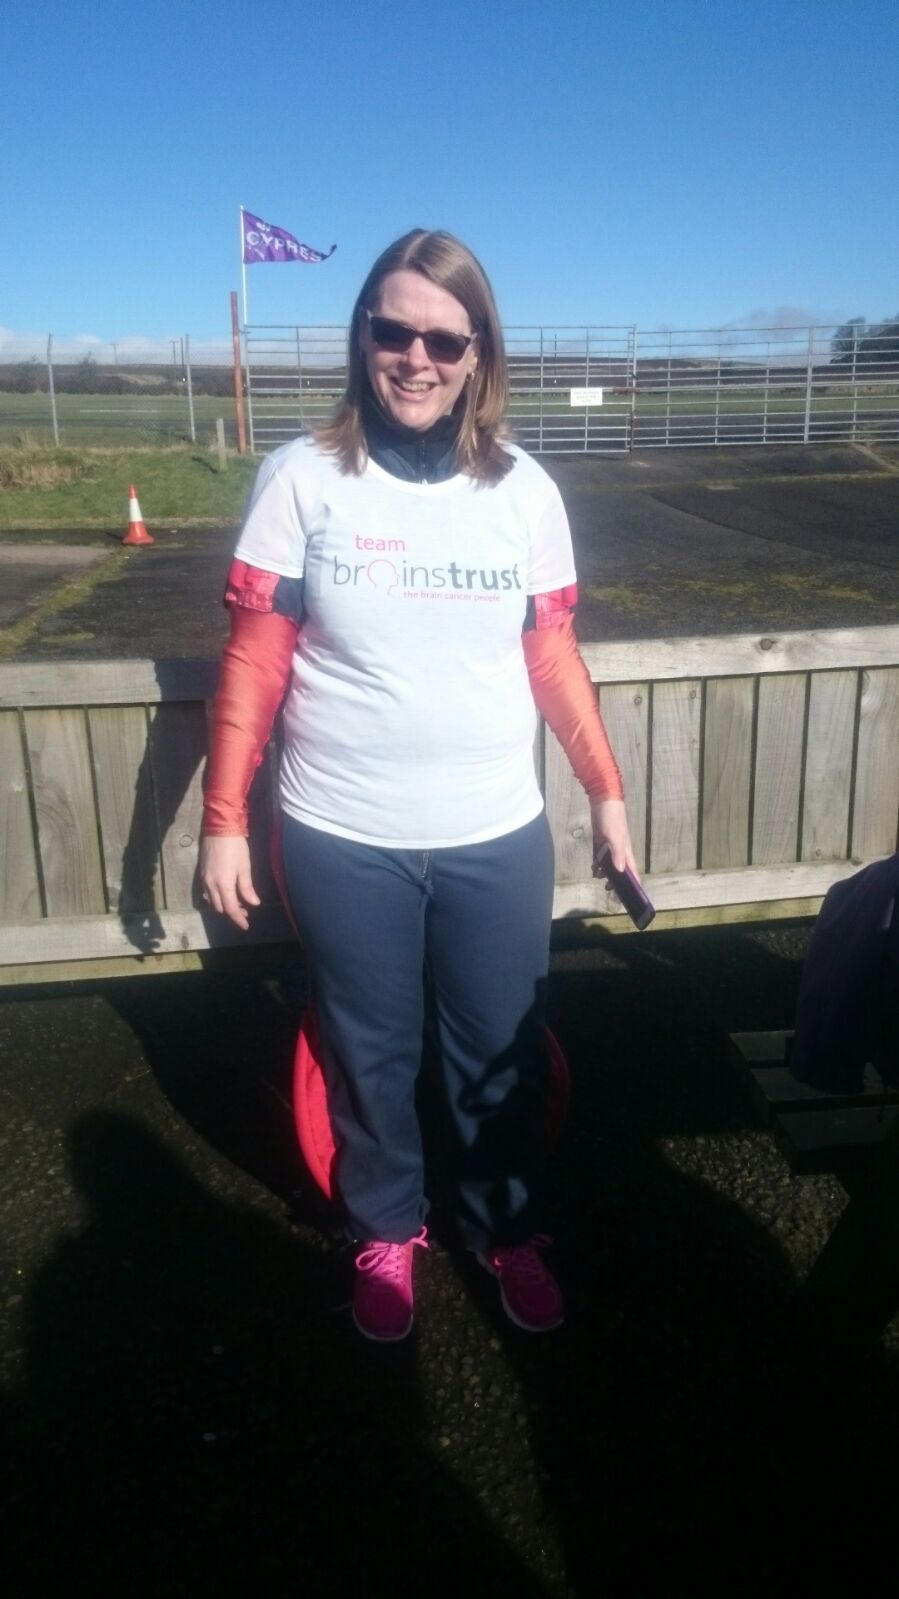
Together Lynn and Carol, who was jumping in memory of her dad, prepared for a skydive at St Andrews in Fife on Mother’s Day last year. “It was really nerve-racking but exciting at the same time. It was a bit cloudy at first, but then the blue skies appeared. It was as if Garreth and Carol’s dad were looking down on us.”


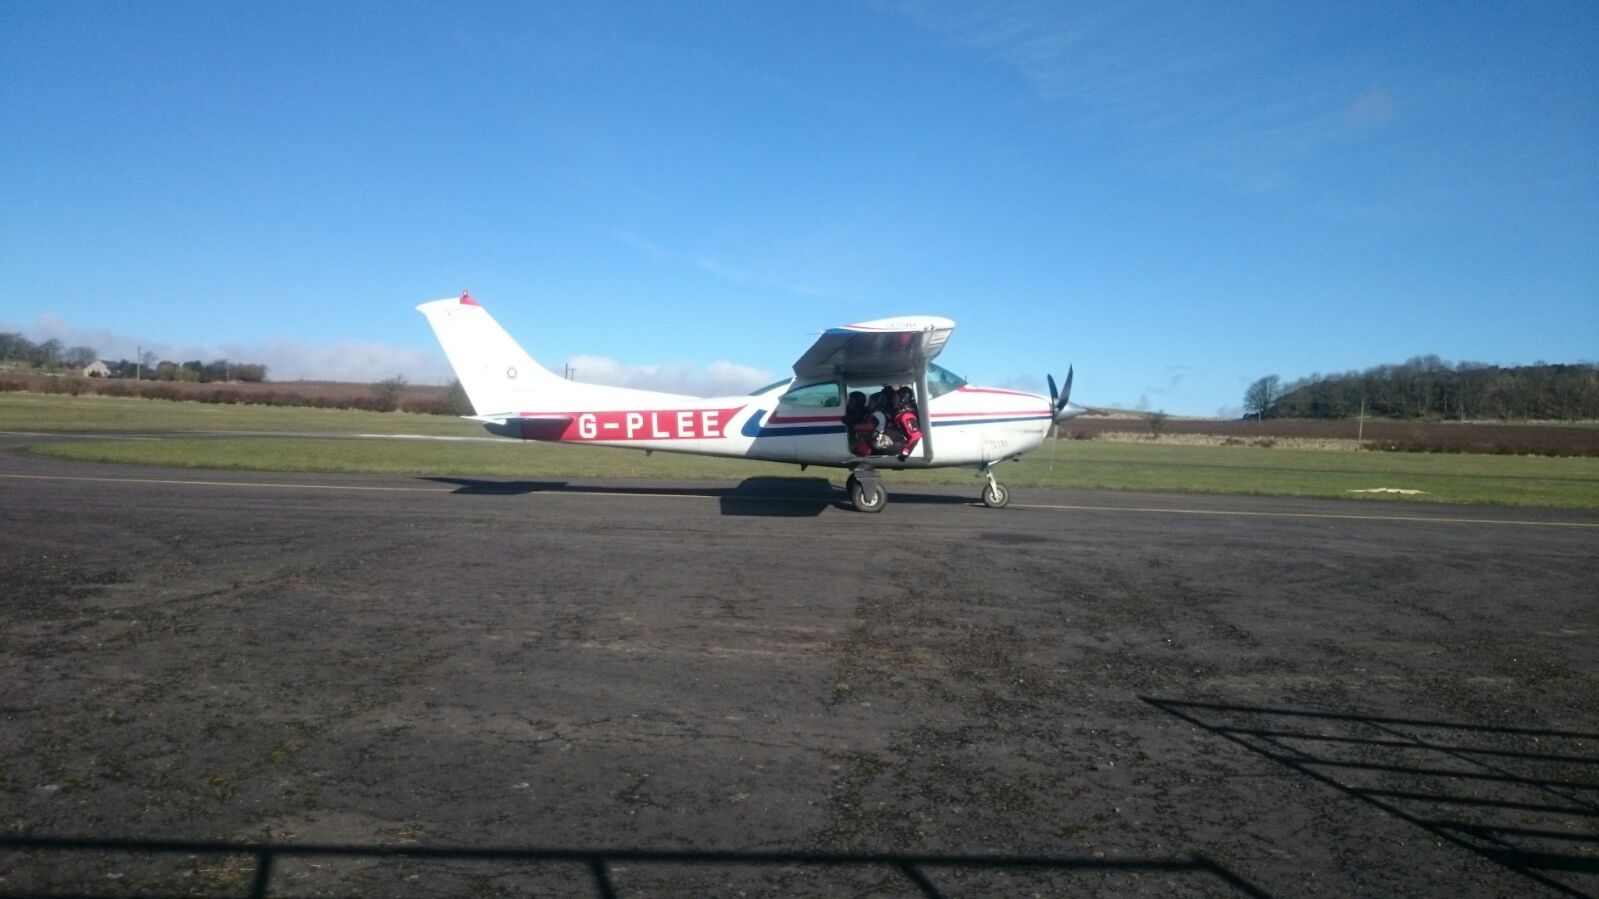
A plane took the group 10,000 feet up, and then it was time. “I’m not going to lie. It was quite scary, especially not knowing what to expect. I suffer from travel sickness so I was thinking about that too. On the flight, the instructors were great at letting you know what was happening. I felt really calm in the plane. I just thought about why I was doing this crazy challenge. The fall out of the plane was the thing I was most worried about, but it was amazing, very peaceful. I took in all the views, and apart from feeling a little sick due to my motion sickness, it was a brilliant experience.”


Liz with skydive instructor

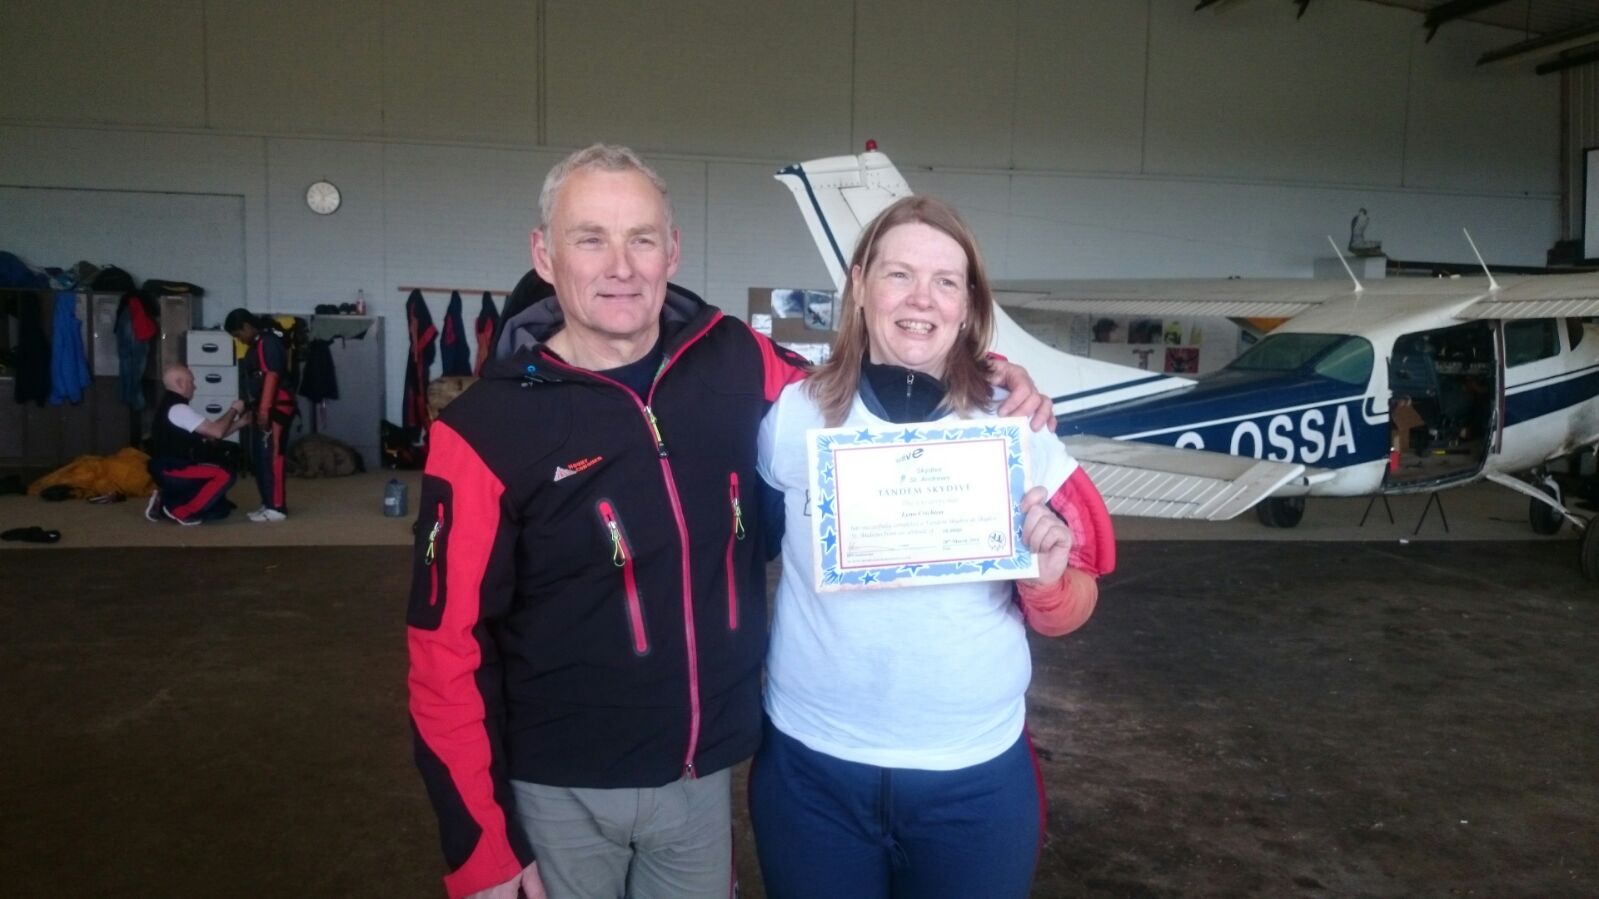
As well as conquering her motion sickness, Lynn was delighted to raise more than £1,000 to help people with brain cancer, which was well over her £500 target.

A fantastic achievement. Well done, Lynn!

If you’d like to sign up to a skydive we have places available. Email carol@brainstrust.org.uk or call 01983 217154. Sign up today and help thousands of people living with a brain tumour diagnosis.

Introduction

The Brain Tumour Data Dashboard lets you explore up -to-date, population level data about the brain tumours diagnosed in England between 2013 and 2015. Using the drop down menus on the left you can select different groups of patients to view in the charts below. In these charts the number of patients for every 100 diagnoses is displayed as images of people. Patients have been grouped by date of diagnosis, type of tumour, age, gender, and region in England.

For each group of patients you can explore the different routes to diagnosis, the proportion of those who received chemotherapy or radiotherapy, as well as the survival of the patients within each group. For more information about what these metrics mean please see the glossary.

How to use

  1. Select the year of diagnosis using the drop down menu.
  2. Select your patient group of interest from the four drop down menus in the following order:
    1. Tumour group
    2. Age at diagnosis
    3. Region of England
    4. Gender of patient
  3. To view a second chart to compare different groups of patients, click the ‘compare’ button.The second chart will appear below the first chart.

*Note that the tool is best used on a laptop or tablet rather than a mobile phone*

Unavailable data

Some of the data in these charts is not available.There are two main reasons for this:

  1. How the data has been grouped

If you cannot select a patient group from the drop down menus, the data is unavailable because of how the data has been organised.

Public Health England has grouped the data like a branching tree. The bottom of the tree contains all the patients with brain tumours, and then each branch divides the data by a certain characteristics, like age, or location of tumour. But the data is divided in an order, starting with location of the tumour (endocrine or brain), then by age, region, and gender. Age is at the start because it makes a bigger difference to survival rates and treatment rates than gender or region. Sometimes, after the data has been split by type of tumour and age, there is not enough data to be split again. This is because to protect patient confidentiality groups cannot contain less than 100 patients. Because some groups cannot be split further, you cannot create ‘totals’ for everyone by region or gender. For example, you cannot see results for all ages by region, or all brain tumours by gender. If these totals were calculated and released, it might be possible to identify patients, which is why Public Health England cannot release this data.

  1. Statistical reasons and data availability

If you can select a patient group from the chart menus, but the chart does not display, the data is unavailable for one of several reasons:

  1. Data is not yet available for the selected year from Public Health England.
  2. Data is not available because the data quality is too poor to release this statistic.
  3. Data is not available as the statistic is not appropriate for this group.
  4. Data is not available because the standard error of the estimate was greater than 20% and so the estimate has been supressed.

Up to date brain tumour data

Brain tumour data may influence the decisions you make about your care. Data also helps you understand the bigger picture, or landscape, in which you find yourself.

Brain tumour data and statistics influence the focus, and work of organisations like brainstrust. The information helps us to understand the scale and impact of the problems we are setting out to solve.

This tool helps you understand the landscape in which you find yourself having been diagnosed with a brain tumour. This landscape can be particularly tricky to navigate as there are many different types of brain tumour, all of which have a different impact.

The information you see represents the most up-to-date, official, population level brain tumour data available for England. Over time we will be adding to the brain tumour data available and publishing reports, with recommendations, as a result of what we learn from this data.

The data behind this content has come from Public Health England’s National Cancer Registration and Analysis Service (NCRAS) and is a direct result of the ‘Get Data Out’ project.

This project provides anonymised population level brain tumour data for public use in the form of standard output tables, accessible here: http://cancerdata.nhs.uk/standardoutput

Incidence

The number or rate (per head of population) of new cases of a disease diagnosed in a given population during a specified time period (usually a calendar year). The crude rate is the total number of cases divided by the mid-year population, usually expressed per 100,000 population.

Malignant

Malignant tumours which grow by invasion into surrounding tissues and have the ability to metastasise to distant sites

Mortality

The number or rate (per head of population) of deaths in a given population during a specified time period (usually a calendar year). The crude rate is the total number of deaths divided by the mid-year population, usually expressed per 100,000 population.

Non-malignant

Not cancerousNon-malignant tumours may grow larger but do not spread to other parts of the body.

Survival

The length of time from the date of diagnosis for a disease, such as cancer, that patients diagnosed with the disease are still alive. In a clinical trial, measuring the survival is one way to see how well a new treatment works. Also called ‘overall survival’ or ‘OS’.

Routes to Diagnosis

Under the ‘Routes to Diagnosis’ tab in the Brain Tumour Data Dashboard, you can explore the ways patients have been diagnosed with brain tumours. There are many ways, or routes, for cancers to be diagnosed in the NHS. A ‘route to diagnosis’ is the series of events between a patient and the healthcare system that leads to a diagnosis of cancer. The routes include:

  1. Two Week Wait

Patients are urgently referred by their GP for suspected cancer via the Two Week Wait system and are seen by a specialist within 2 weeks where they are diagnosed.

  1. GP referral

Diagnosis via a GP referral includes routine and urgent referrals where the patient was not referred under the Two Week Wait system.

  1. Emergency Presentation

Cancers can be diagnosed via emergency situations such as via A&E, emergency GP referral, emergency transfer or emergency admission.

  1. Outpatient

Outpatient cancer diagnoses include diagnoses via an elective route which started with an outpatient appointment that is either a self-referral or consultant to consultant referral. (It does not include those under the Two Week Wait referral system).

  1. Inpatient elective

Diagnosis via an inpatient elective route is where diagnosis occurs after the patient has been admitted into secondary care from a waiting list, or where the admission is booked or planned.

  1. Death Certificate Only

Diagnoses made by Death Certificate Only are made where there is no more information about the cancer diagnosis other than the cancer related death notifications. The date of diagnosis is the same as that of the date of death.

  1. Unknown

For some patients with a cancer diagnosis, there is no relevant data available to understand the route to diagnosis.


More information

If any of the statistical terms in this section of the brainstrust website are hard to understand, we recommend looking them up here:

Cancer Research UK’s Cancer Statistics Explained

http://www.cancerresearchuk.org/health-professional/cancer-statistics/cancer-stats-explained/statistics-terminology-explained#heading-Seven

If you are looking for help understanding terms relating specifically to brain tumours, and treatment, then the brainstrust glossary is available here:

https://www.brainstrust.org.uk/advice-glossary.php